227 resources
-
Case Study
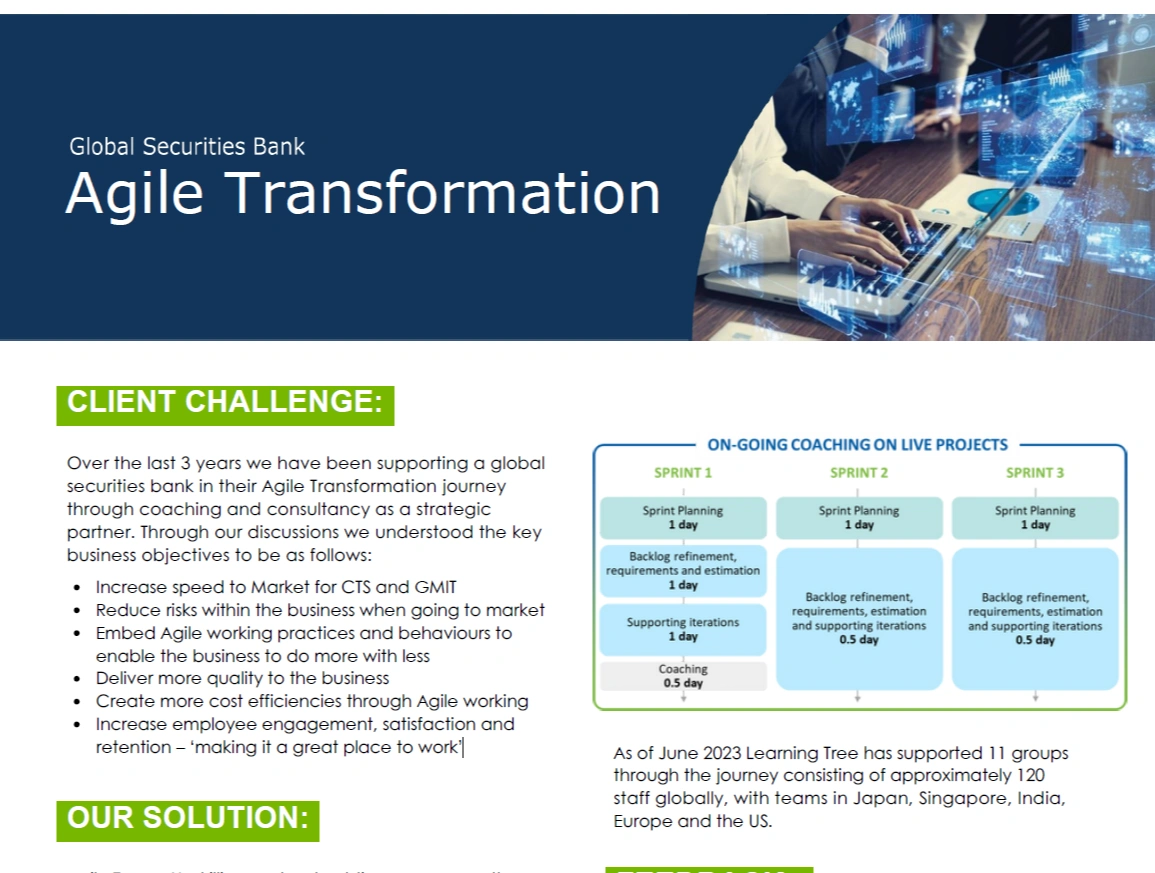
Global Securities Bank - Agile Transformation
-
Case Study
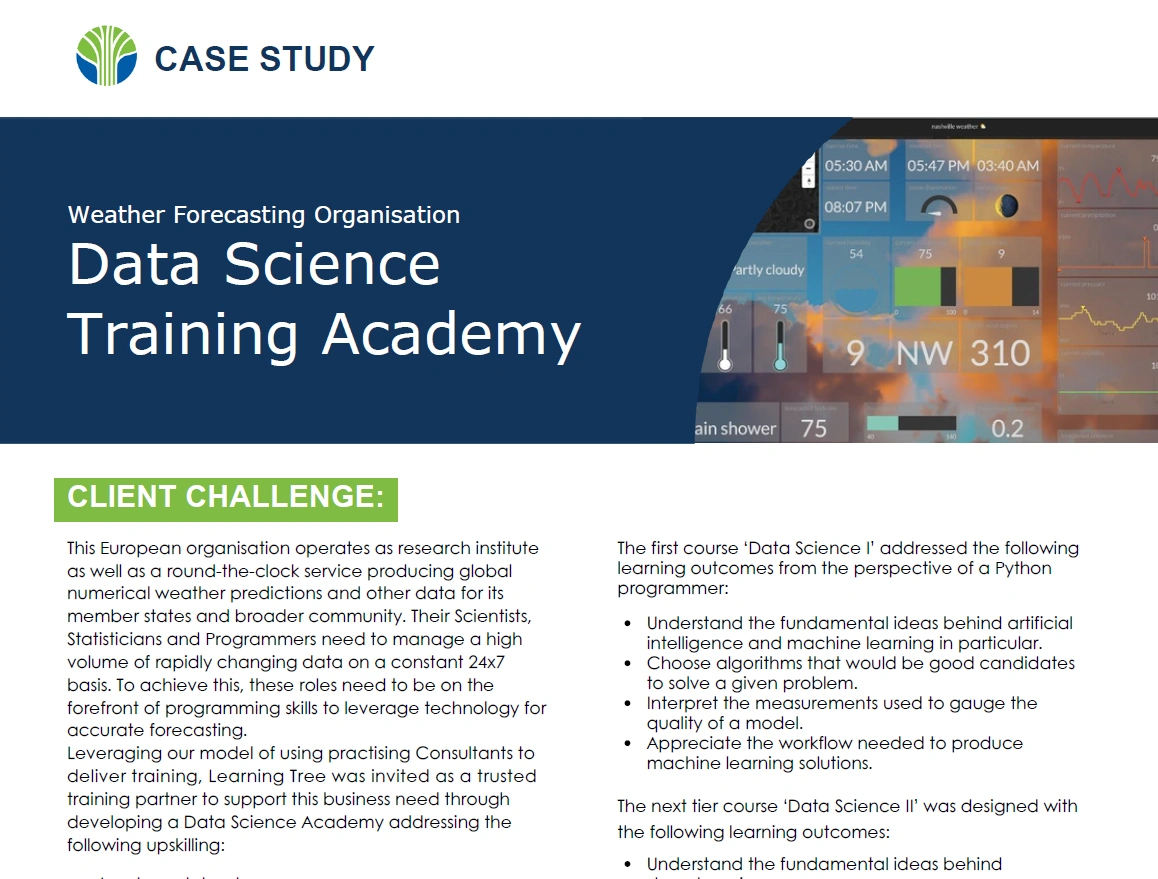
Weather Forecasting Organisation Data Science Training Academy
-
Case Study
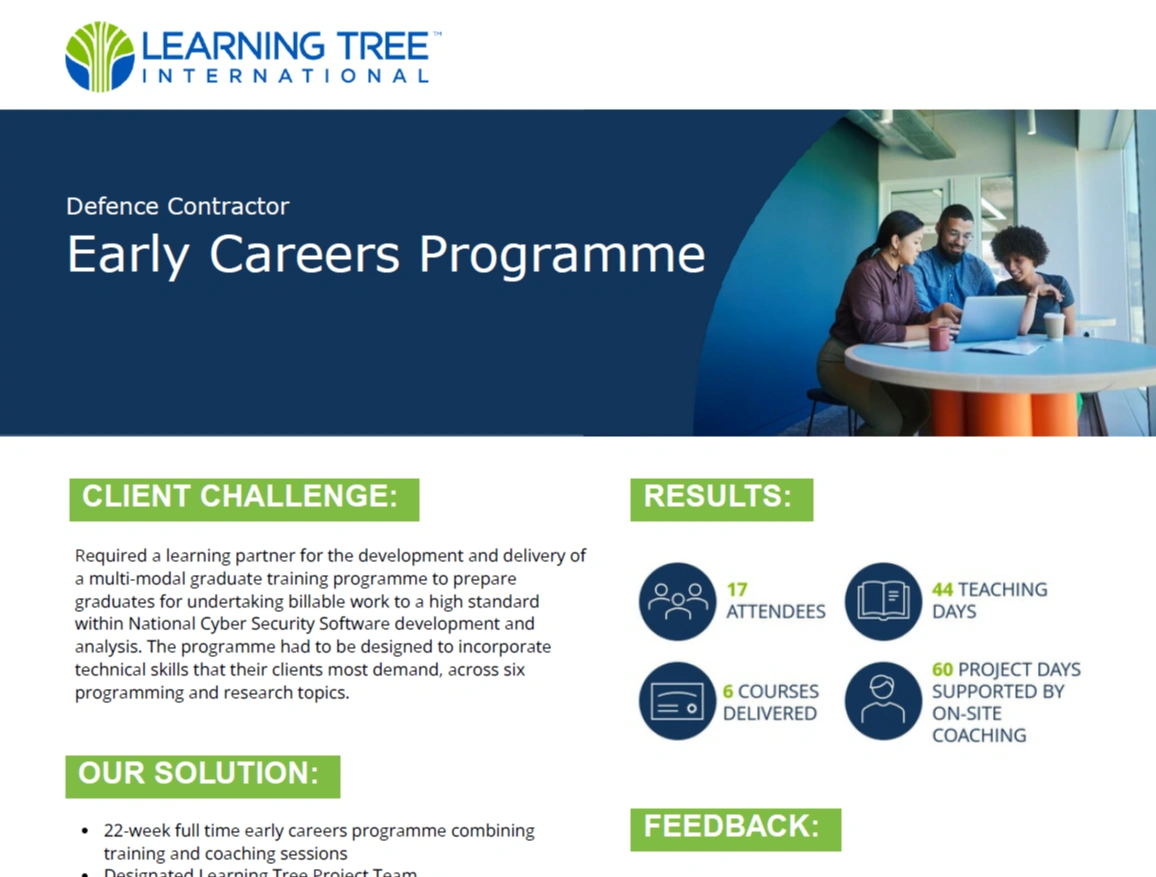
Defence Contractor Case Study: Transforming Graduate Training Programmes
-
Brochure/Learning Path
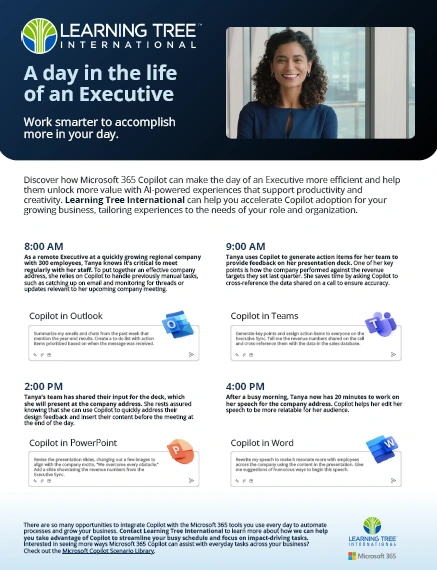
Copilot One pager - A day in the life of an Executive
-
Brochure/Learning Path
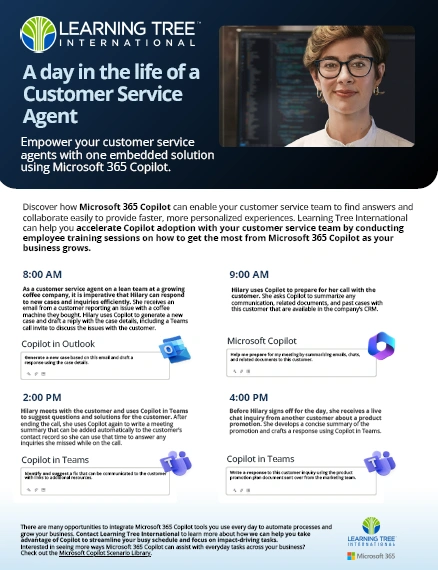
Copilot One Pager - Customer Service Day in the Life
-
Brochure/Learning Path
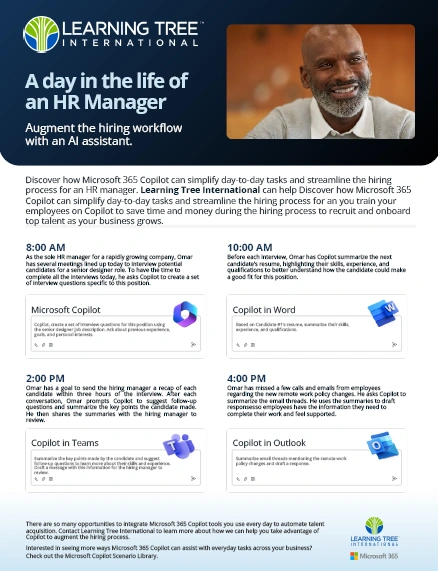
Copilot One Pager - HR Day In The Life
-
Brochure/Learning Path
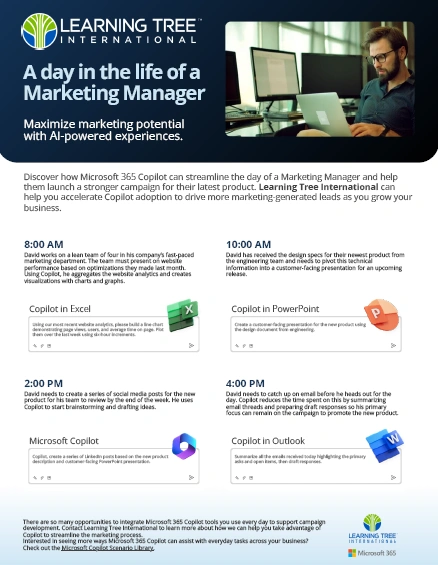
Copilot One Pager - Marketing Day in the Life
-

eBook/White Paper
Ebook - Unlock more business potential with Microsoft 365
-
Case Study
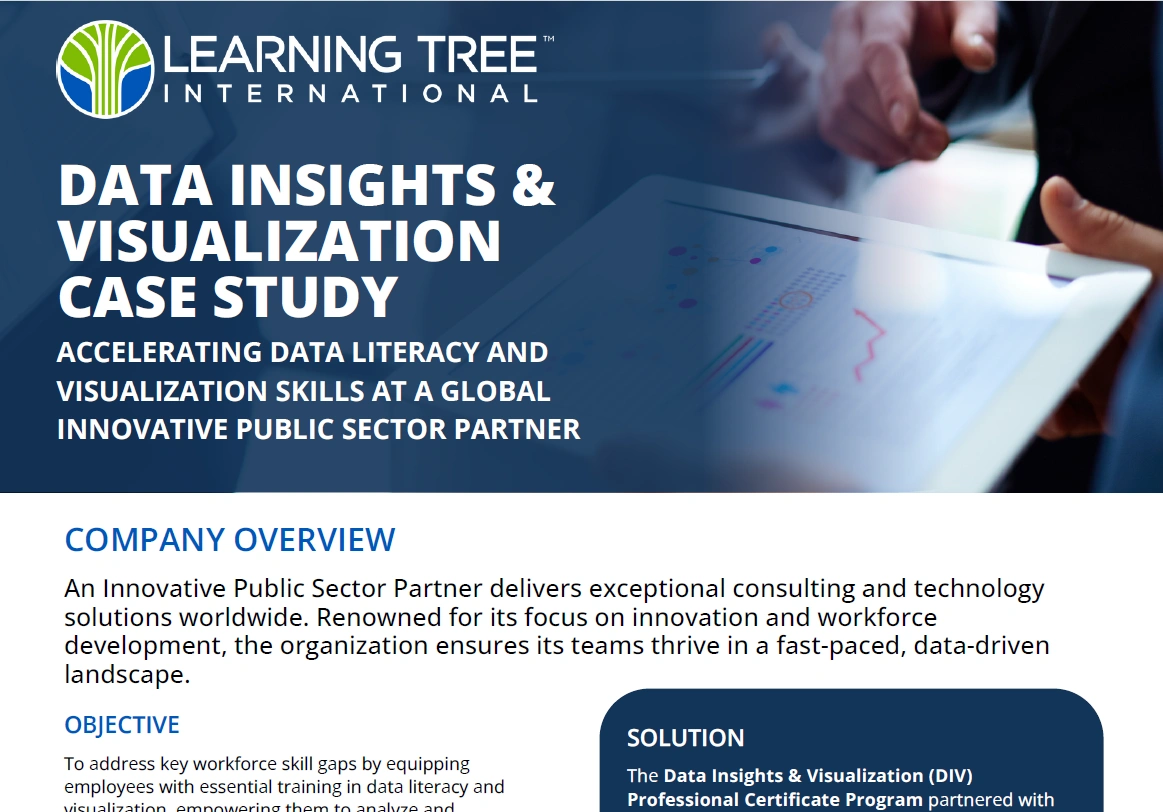
Data Insights and Visualization Case Study
-

Case Study
Case Study: Judicial Council of California Empowers Courts with Tailored Power BI Training from Learning Tree
-
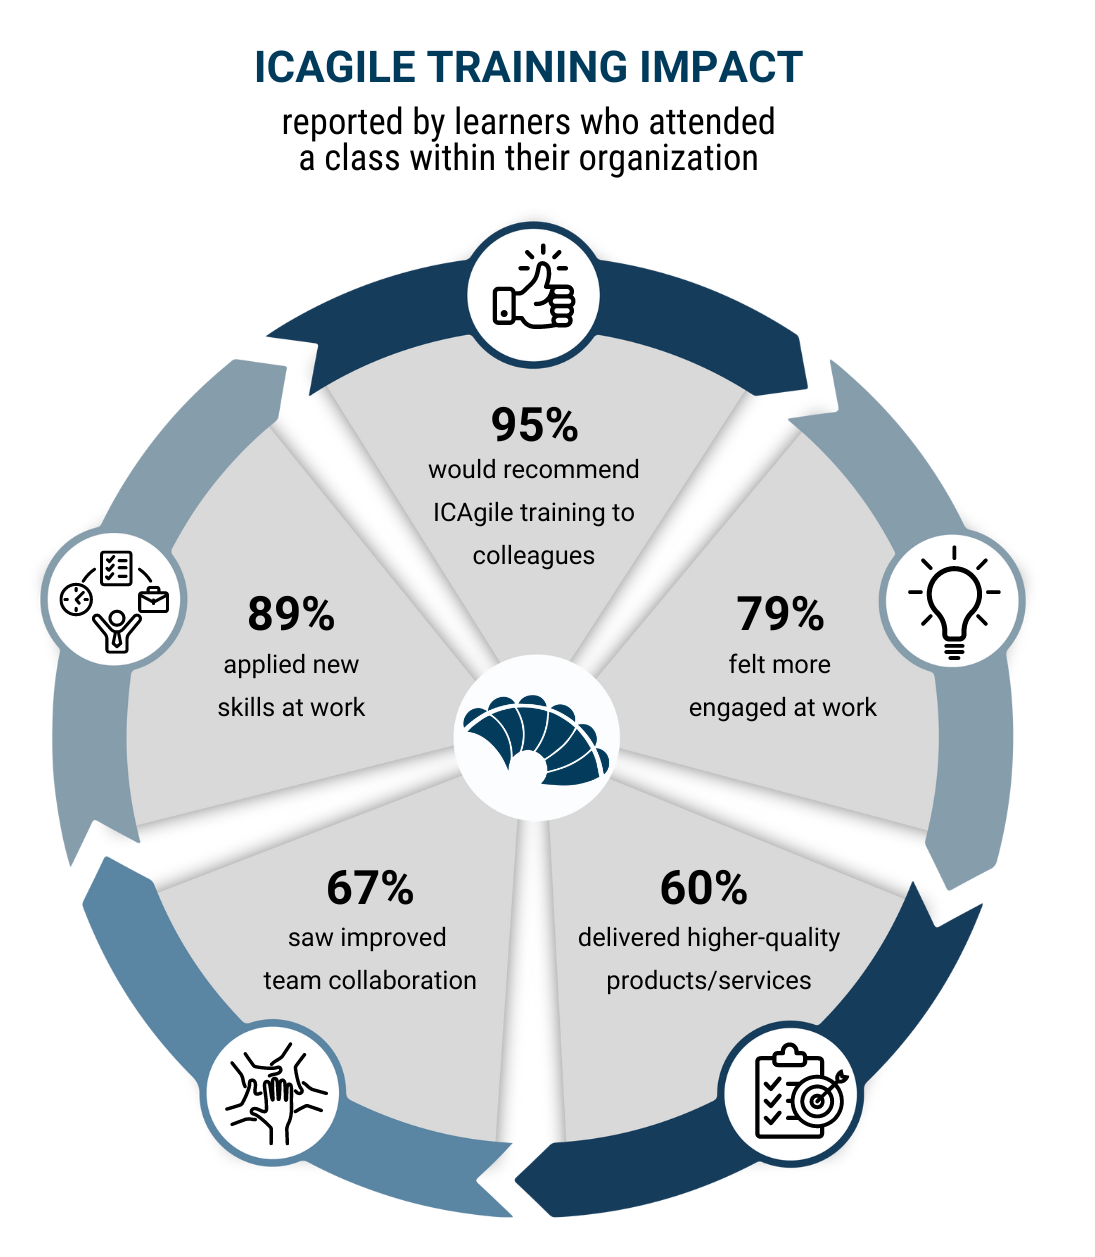
Infographic
ICAgile Training Impact Graphic
-

Case Study
Case Study: Developing Tomorrow’s Leaders Today
-
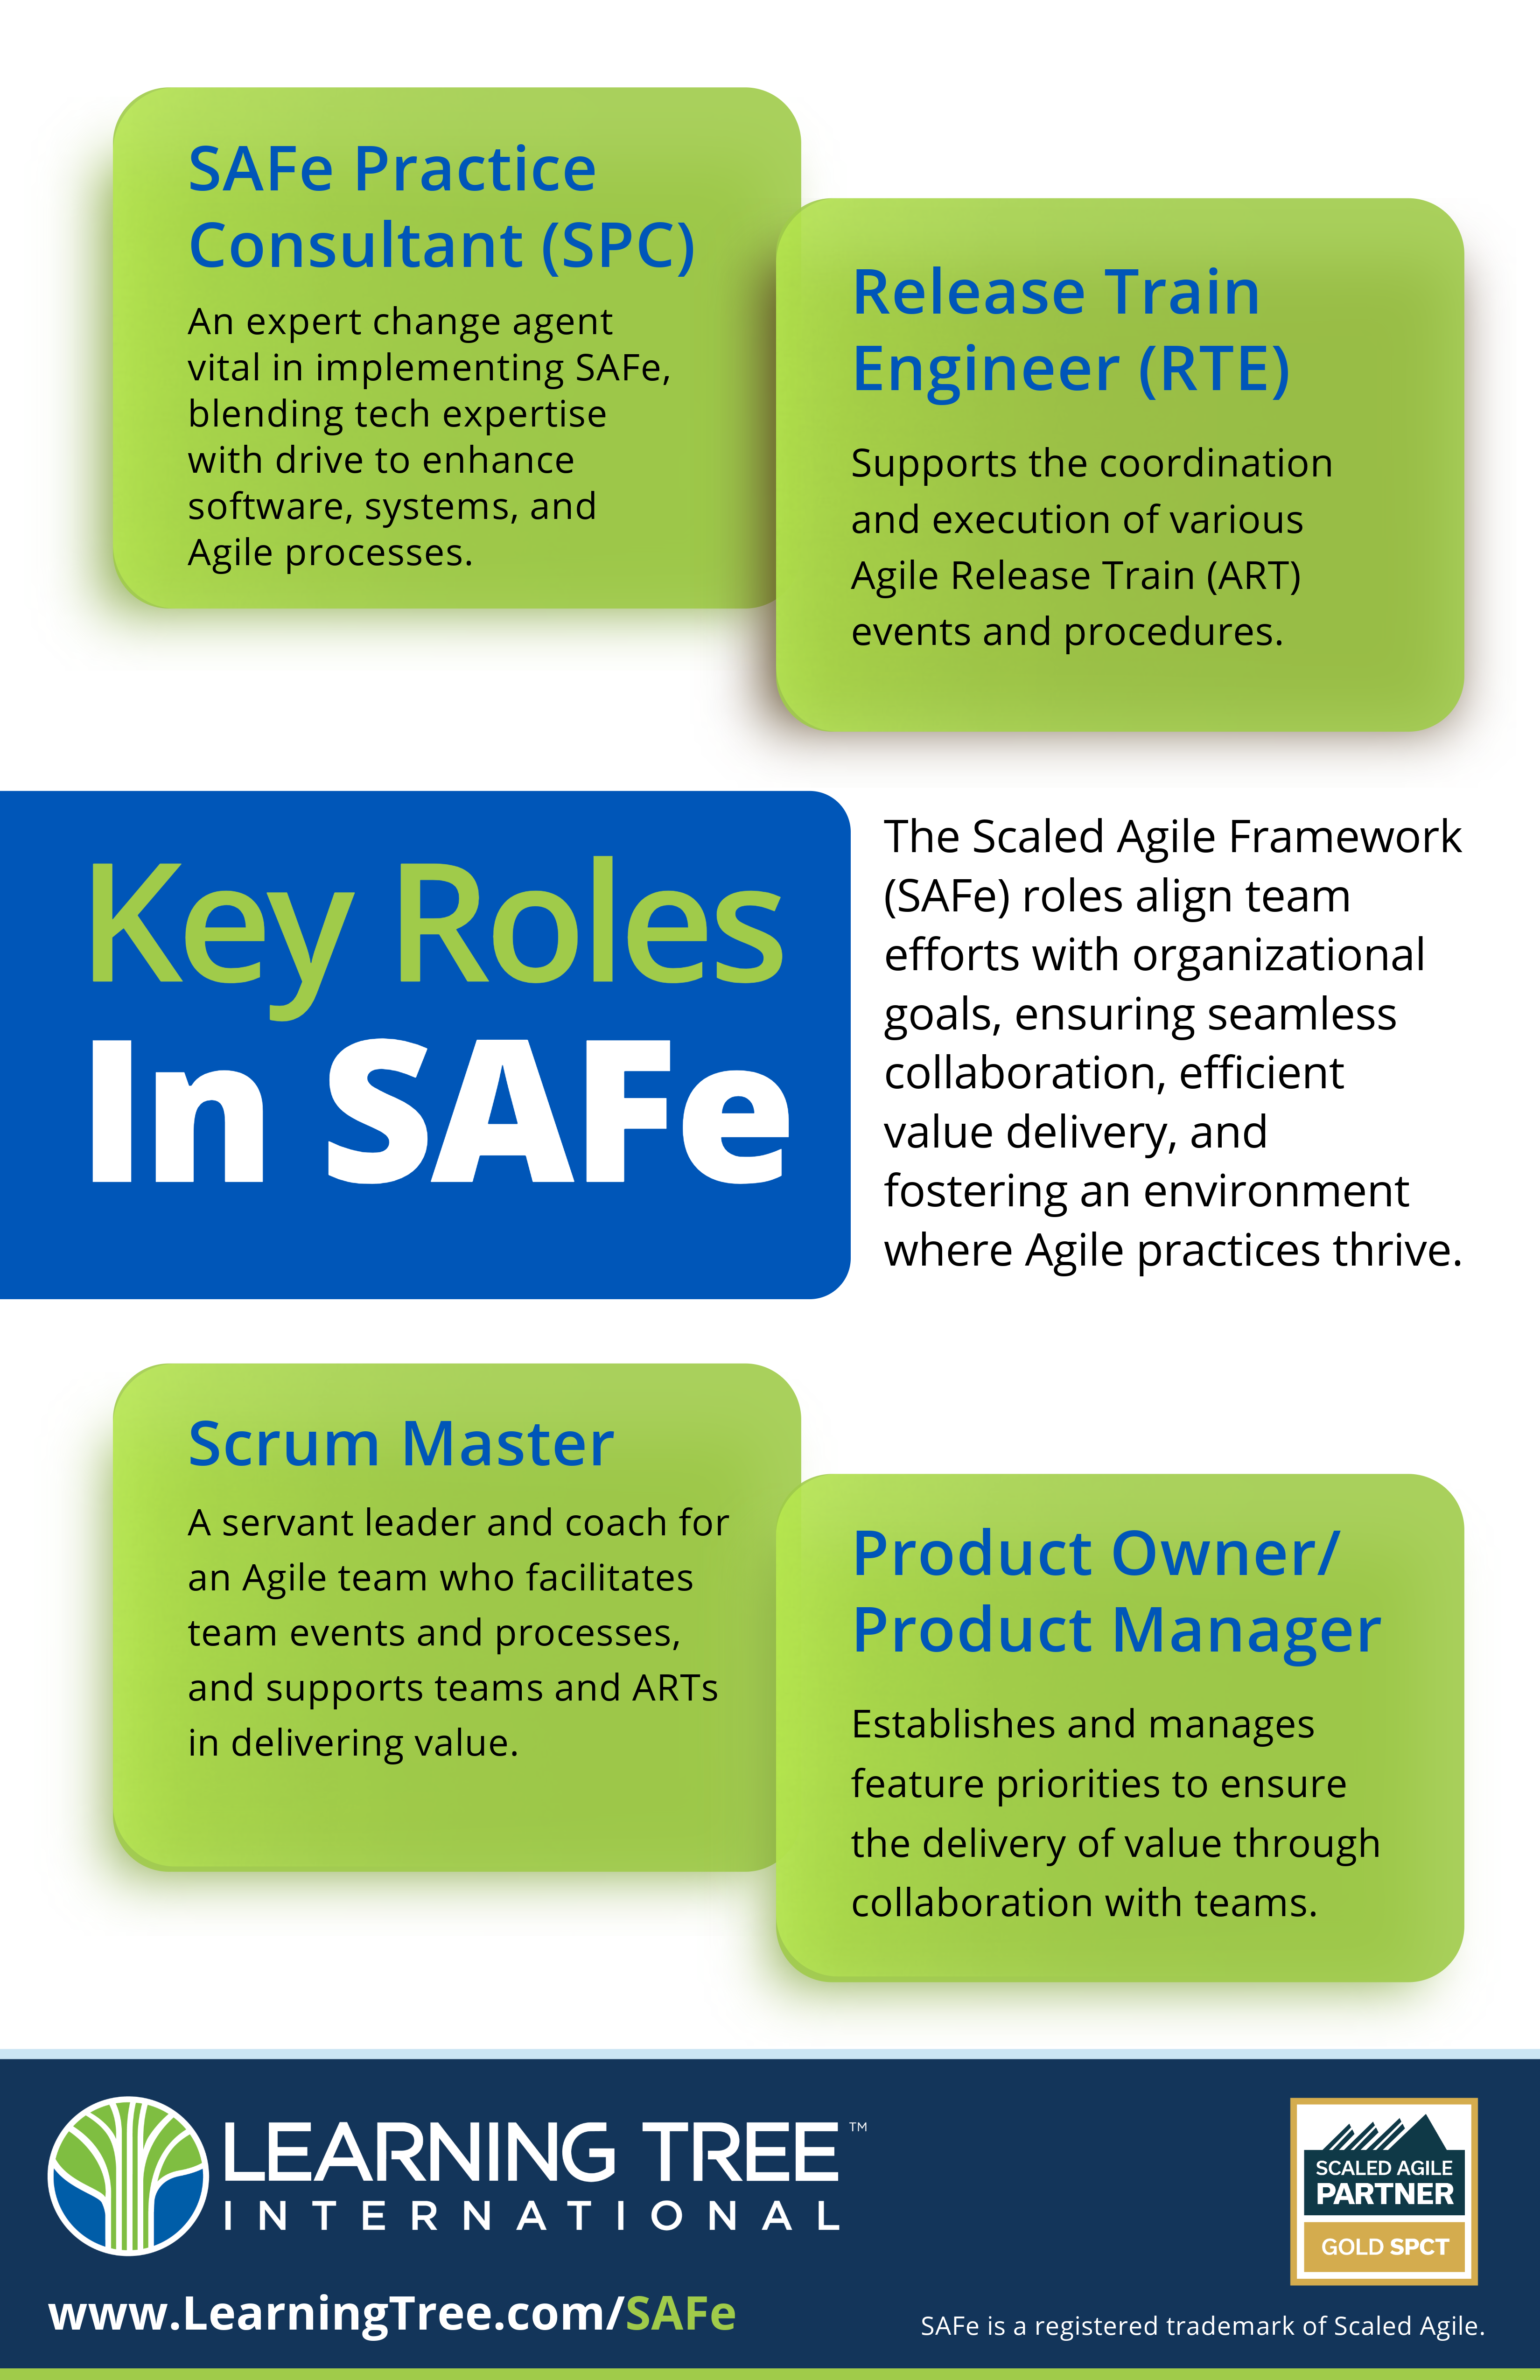
Infographic
Key Roles In SAFe
-

Brochure/Learning Path
CyberShield Workforce Training
-
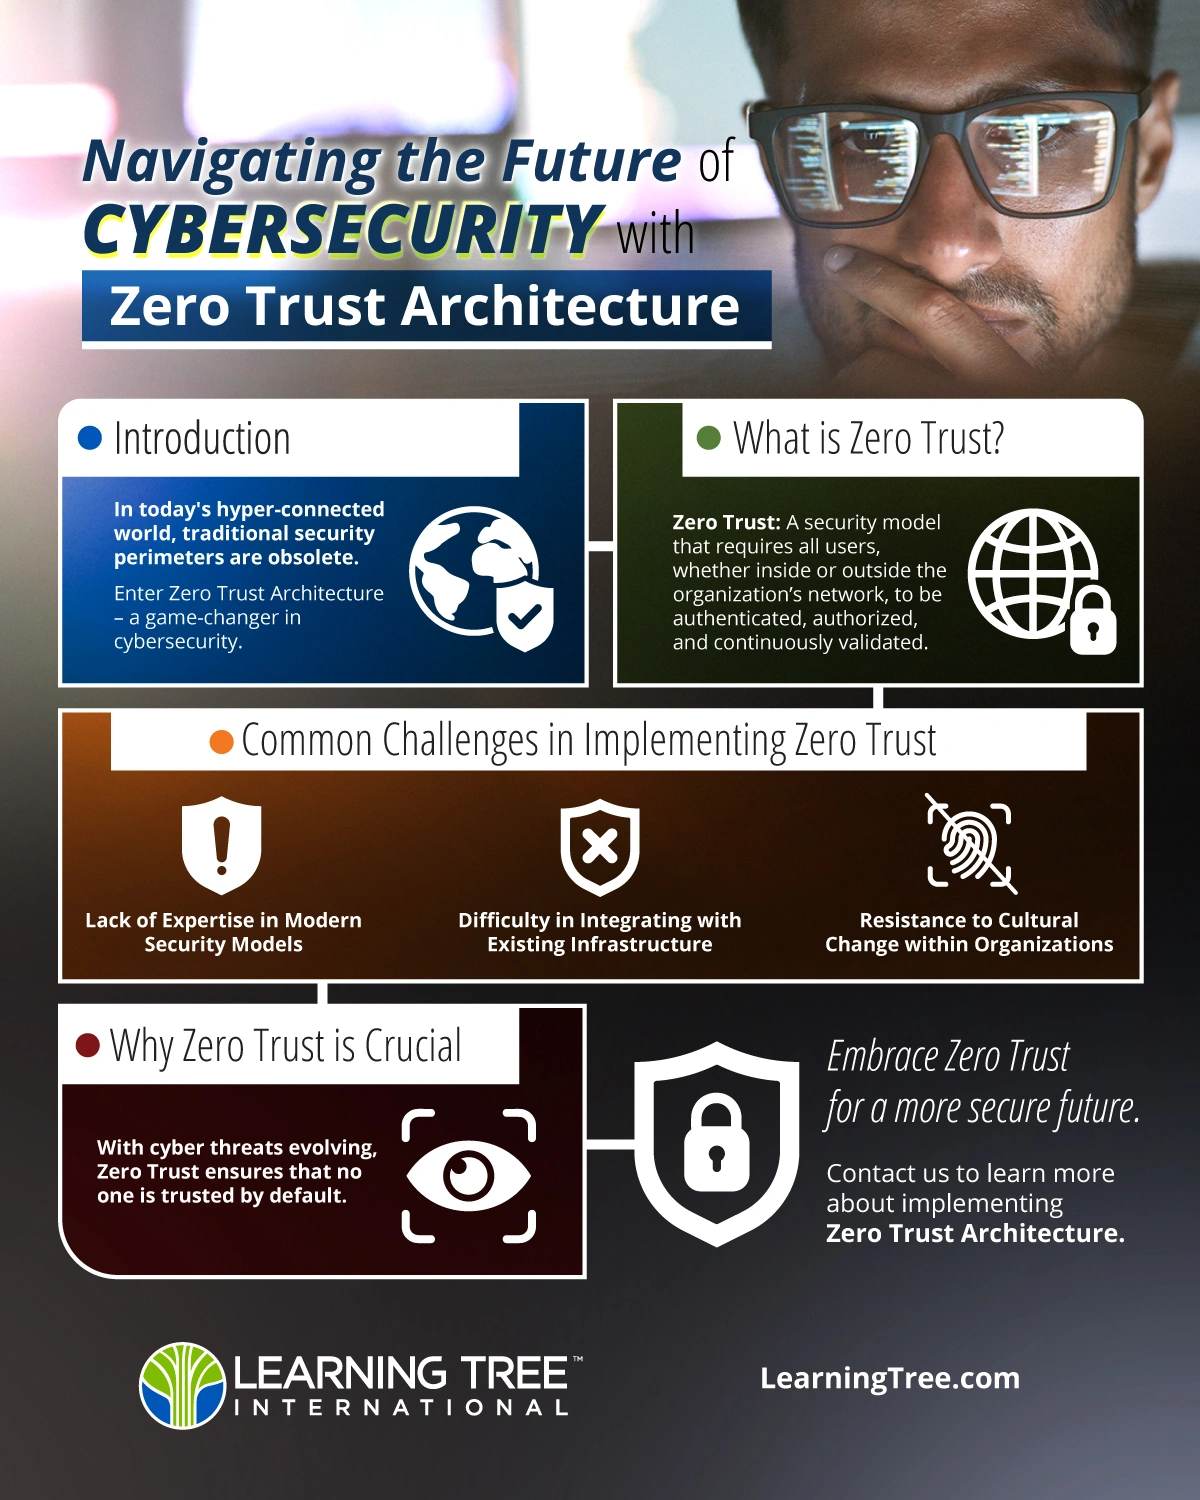
Infographic
Navigating the Future of Cybersecurity with Zero Trust Architecture
-
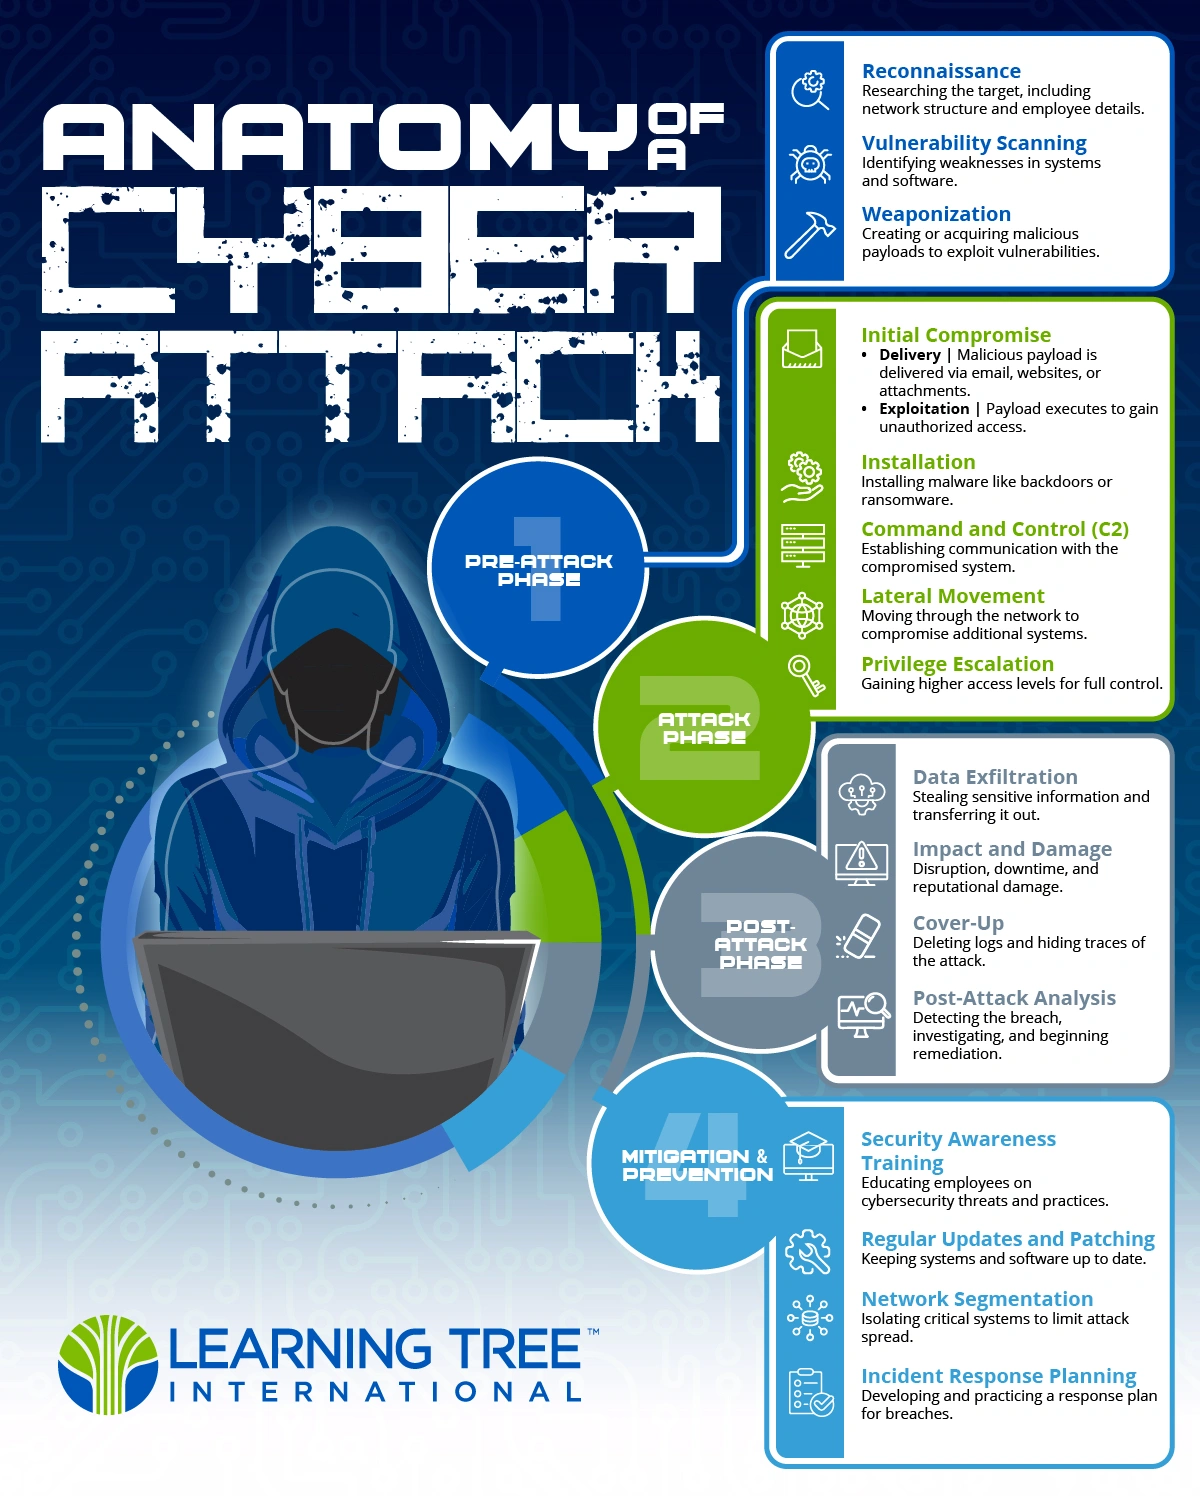
Infographic
Anatomy of a Cyber Attack
-
In the News
Learning Tree International Celebrates 50 Years of Innovation, Impact, and Excellence
-
Infographic
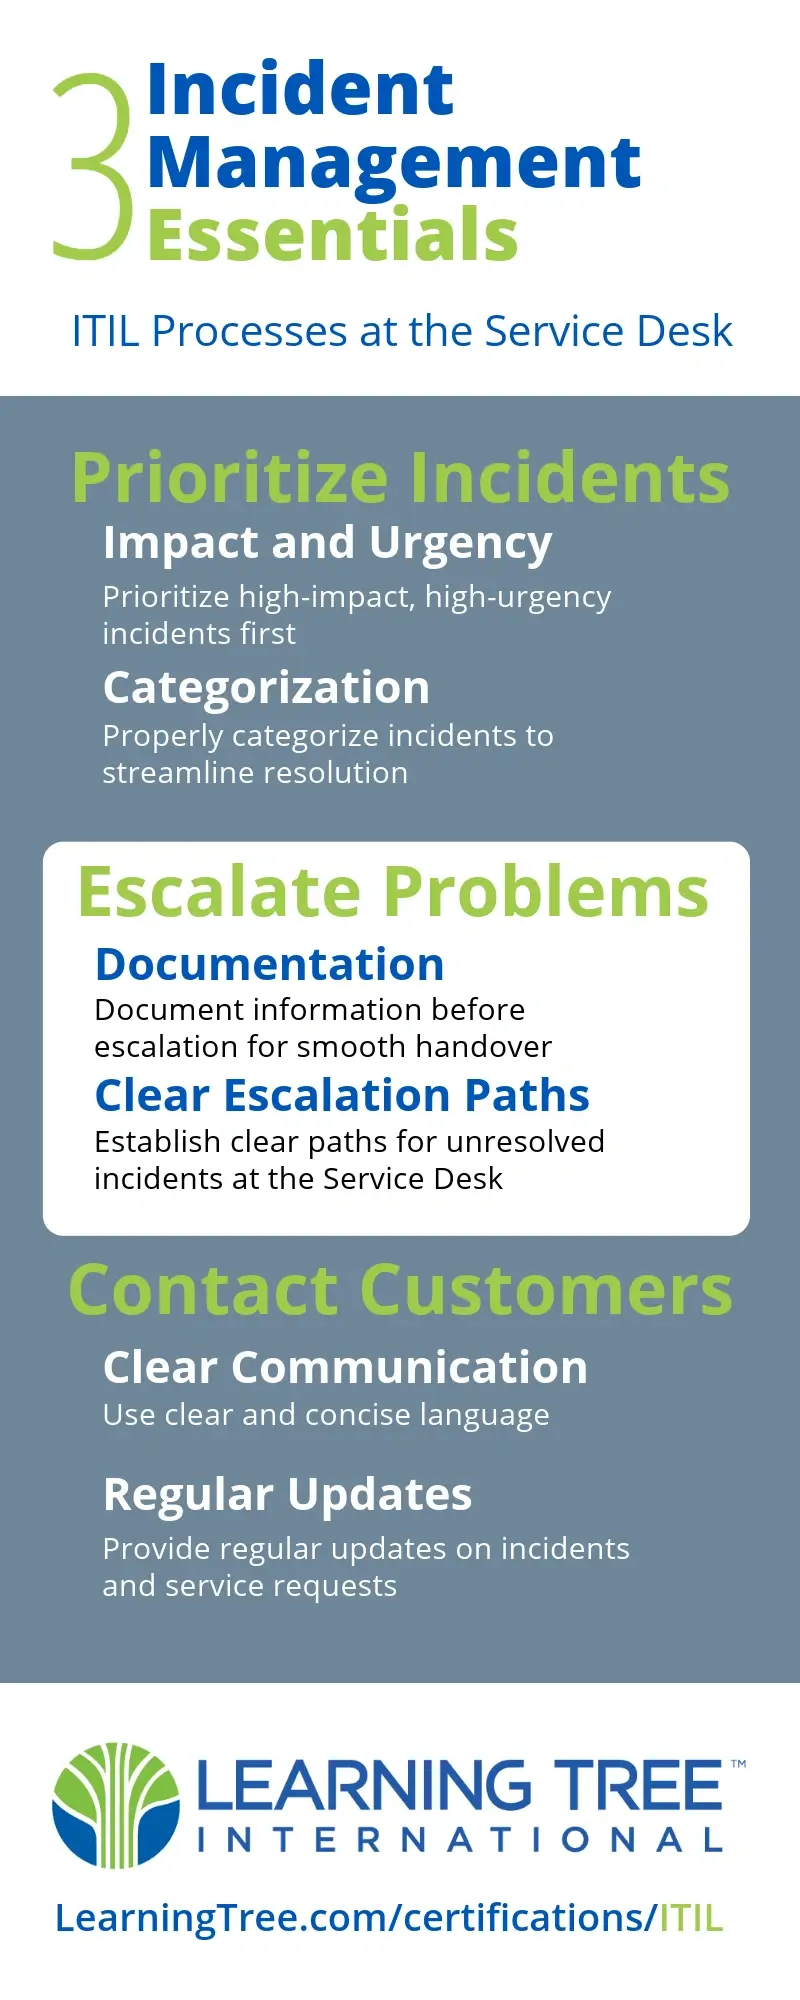
Three Incident Management Essentials
-
Infographic
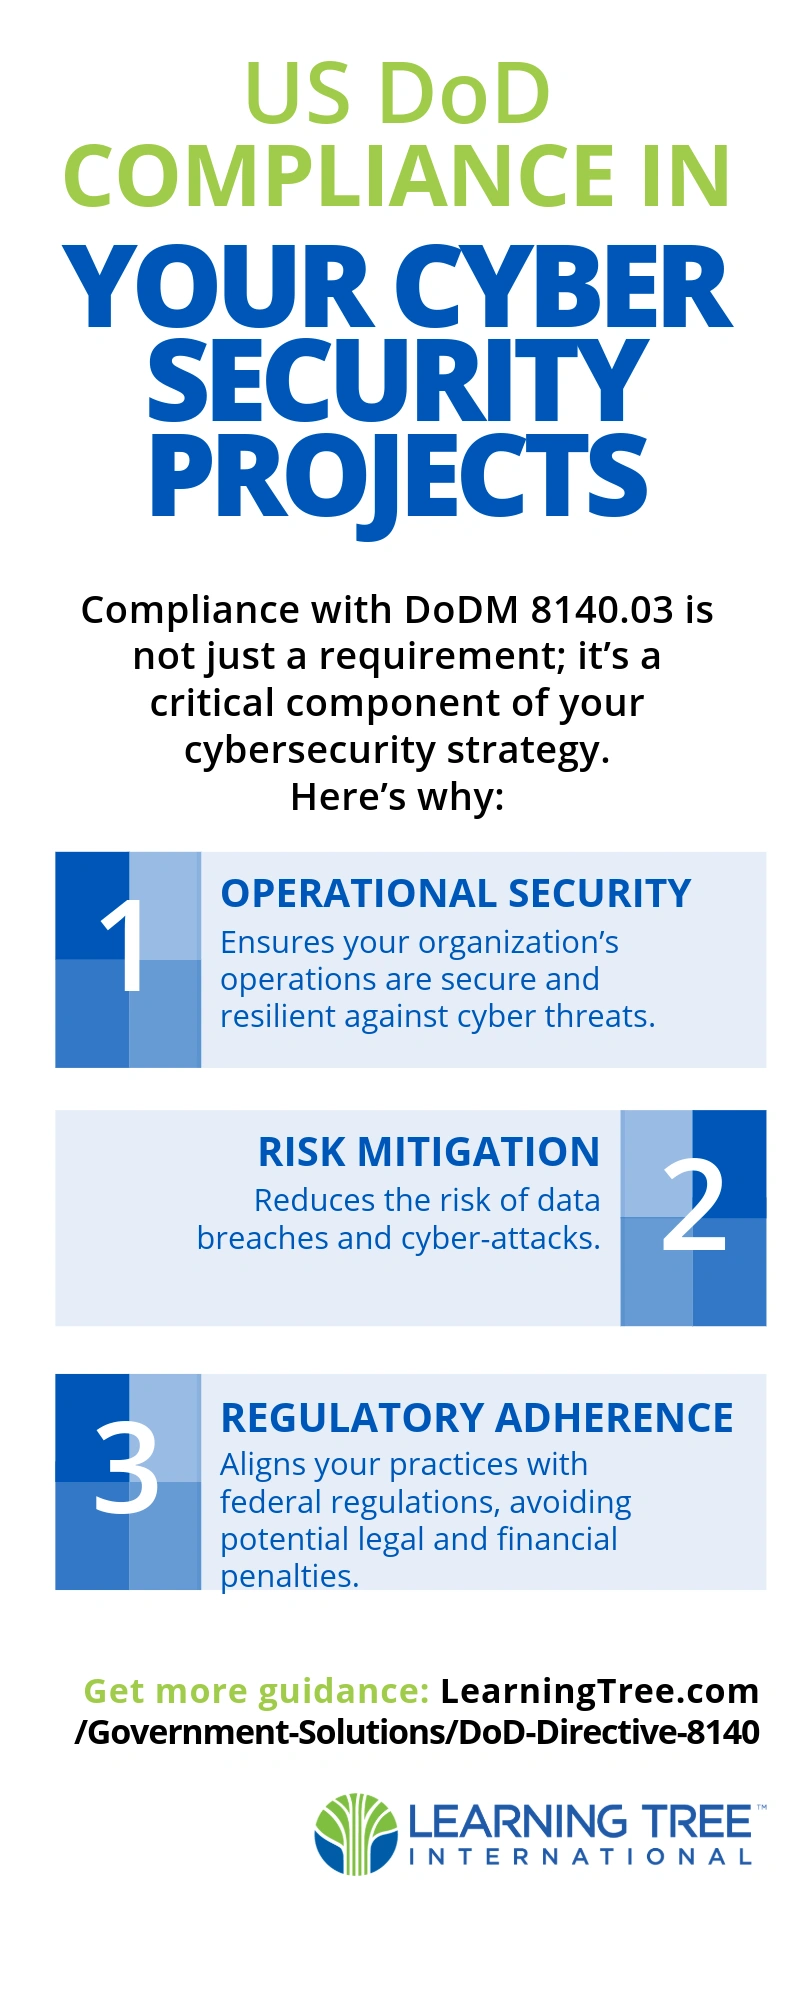
US DoD Compliance in your Cybersecurity Projects
-
Infographic
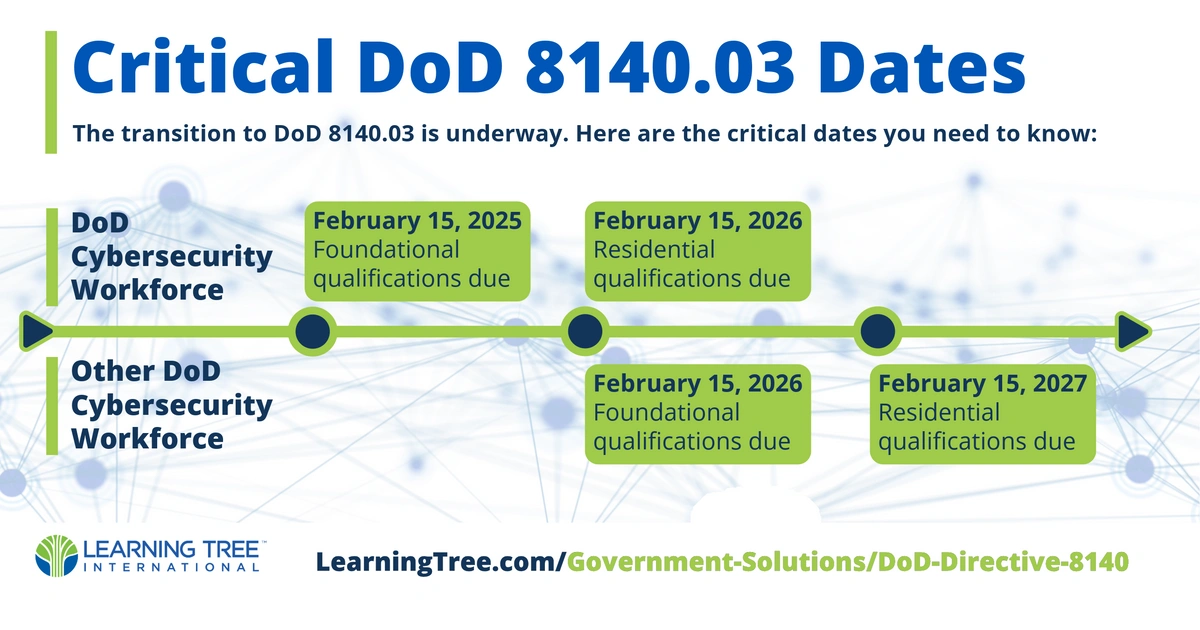
Critical DoD 8140.03 Dates
-
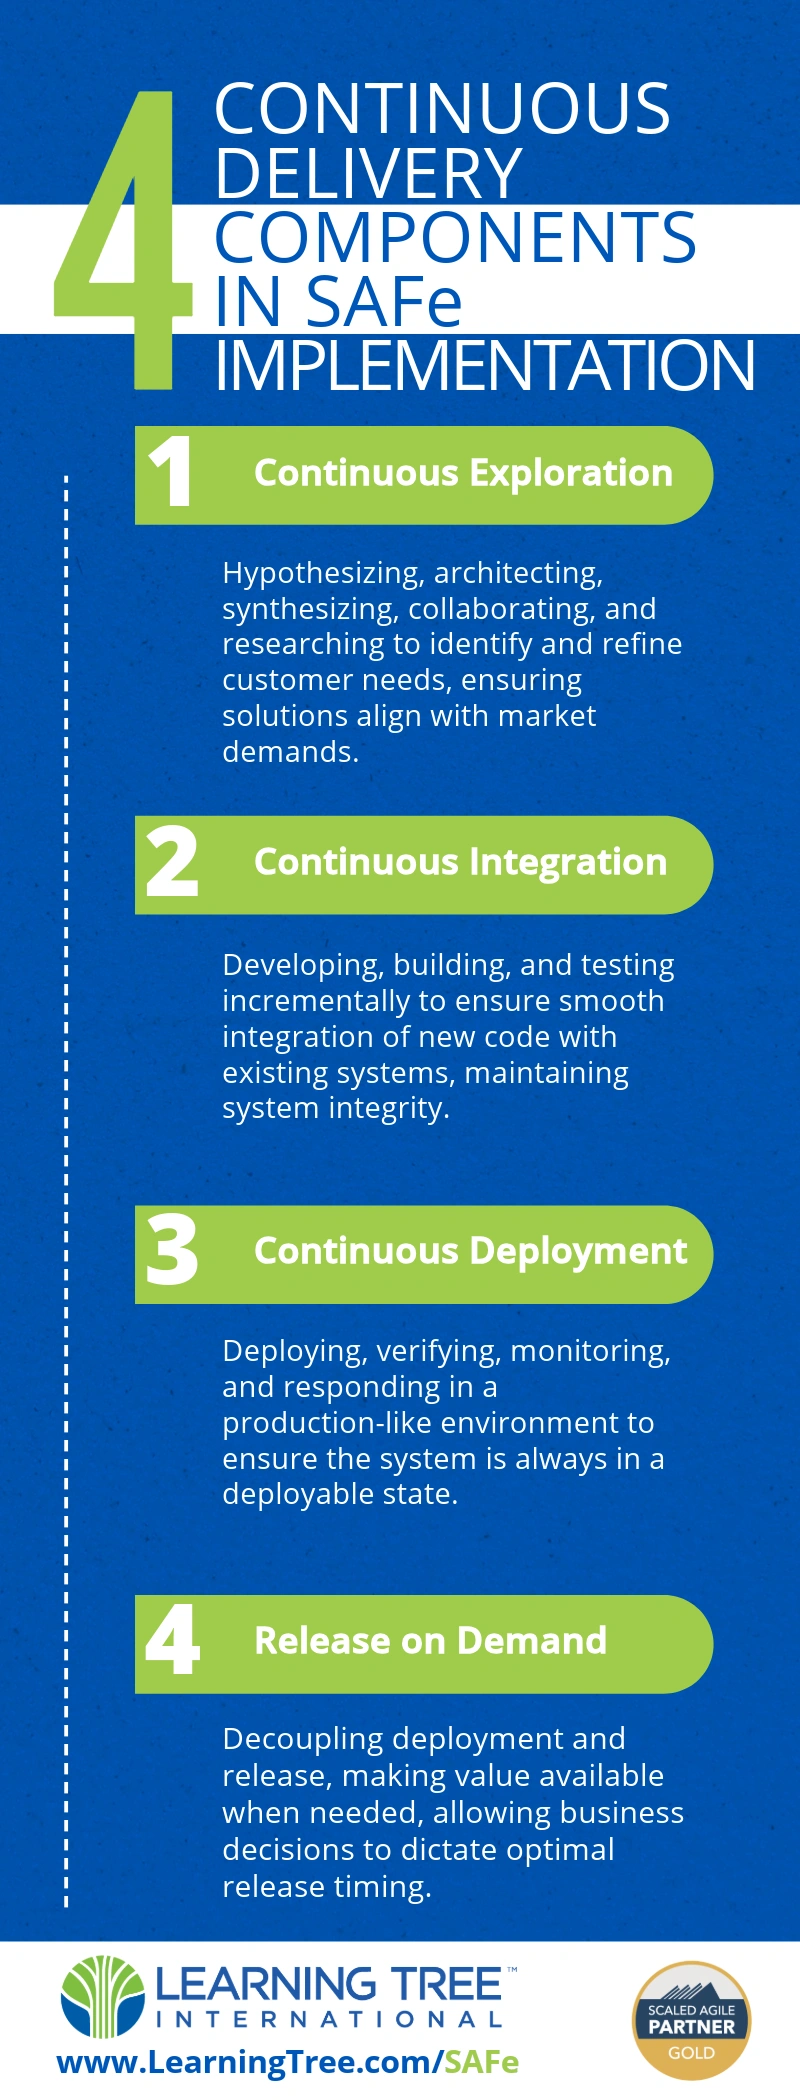
Infographic
4 Continuous Delivery Components In SAFe Implementation
-
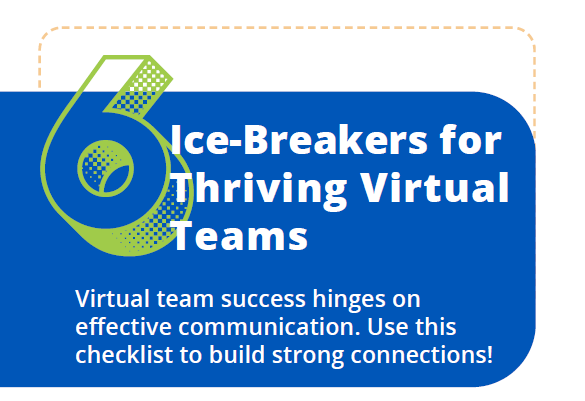
Infographic
6 Ice-Breakers for Thriving Virtual Teams
-

Infographic
The Successful Collaboration Essentials
-

Video
Transactional vs. Transformational Leadership - Erica Elam Sims
-

Video
Leadership for Everyone - Jonathan Gilbert
-

Video
The Value of People Skills - Ajitha Srinivasan
-

Video
Overcoming Change Opposition - Erica Elam Sims
-

Video
The Power of Trust in Leadership - Jonathan Gilbert
-

Video
Networking in Virtual Teams - Ajitha Srinivasan
-
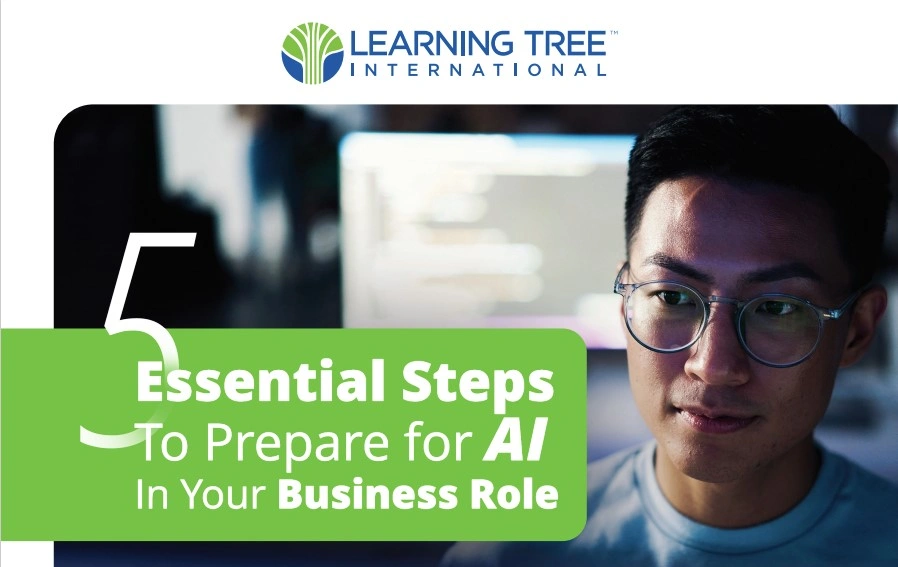
Infographic
AI Business Users: 5 essential steps to prepare for AI
-
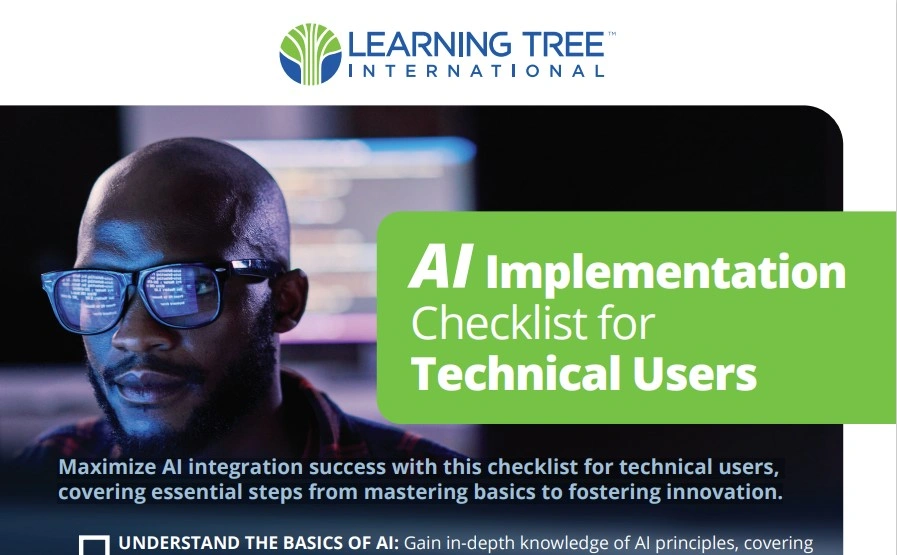
Infographic
AI Implementation Checklist for Technical Users
-
Brochure/Learning Path
Project Management for Leaders
-

Brochure/Learning Path
Project Management for Individuals
-
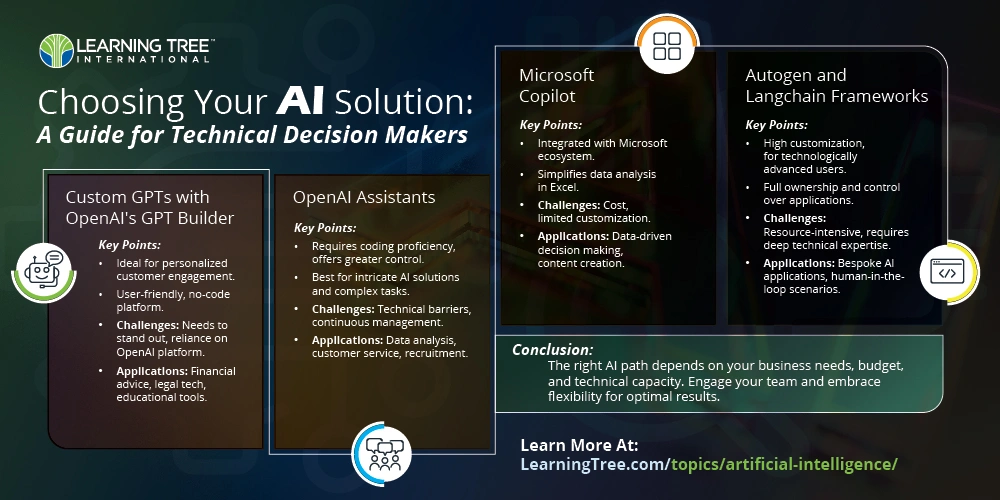
Infographic
Choosing Your AI Solution
-

Case Study
Case Study - PMP Enterprise
-
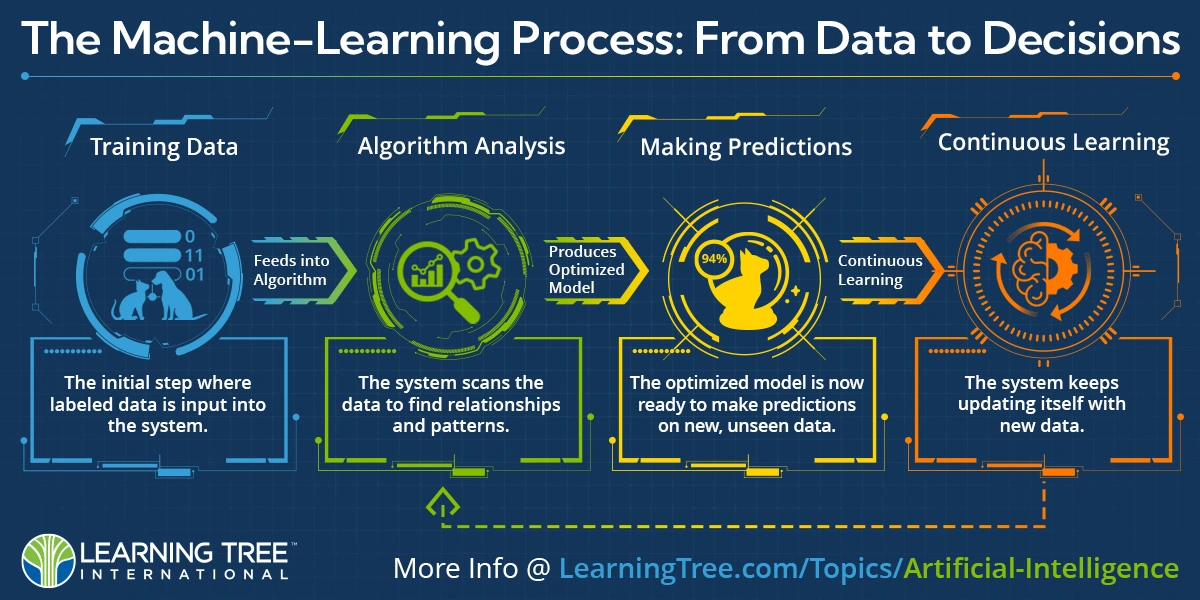
Infographic
The Machine-Learning Process: From Data to Decisions
-
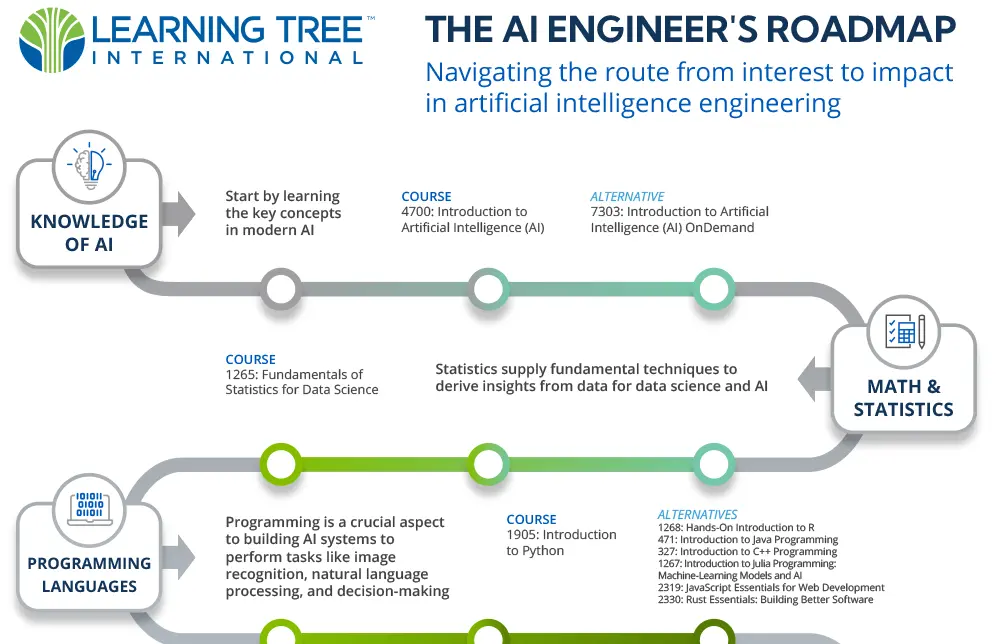
Infographic
AI Engineer Roadmap
-
Brochure/Learning Path
Defend Your Organization from Cyber Threats
-

In the News
Learning Tree Launches New One-Day ITIL 4® Course to Help Professionals Recertify Before June 30 Deadline
-
Video
The Duke CE Advanced Leadership Program: Creating People-First Leaders
-
Video
The Agile State of Mind
-
Video
The Duke CE Advanced Leadership Program - Learning Tree - Trailer
-
In the News
CMMC 2.0 CCP Course Announcement
-
In the News
Learning Tree Announces Official AWS Training Solutions with Tailored Certification Paths and Discovery Release Dates to Support Cloud-Based Skills Training for IT Professionals
-

Brochure/Learning Path
Learning Tree's Top 5 Cyber Certifications
-
In the News
Duke Corporate Education and Learning Tree Form New Partnership to Cultivate Key Leadership Skills for Technical Leaders
-

Infographic
Cross-Functional Teams: The Cornerstone of Business Agility
-
In the News
Learning Tree Recognized as Top 20 IT Training Company for Twelfth Year
-
Video
Q&A: As a veteran Project Manager, what is the most recent "lesson learned" you've experienced?
-
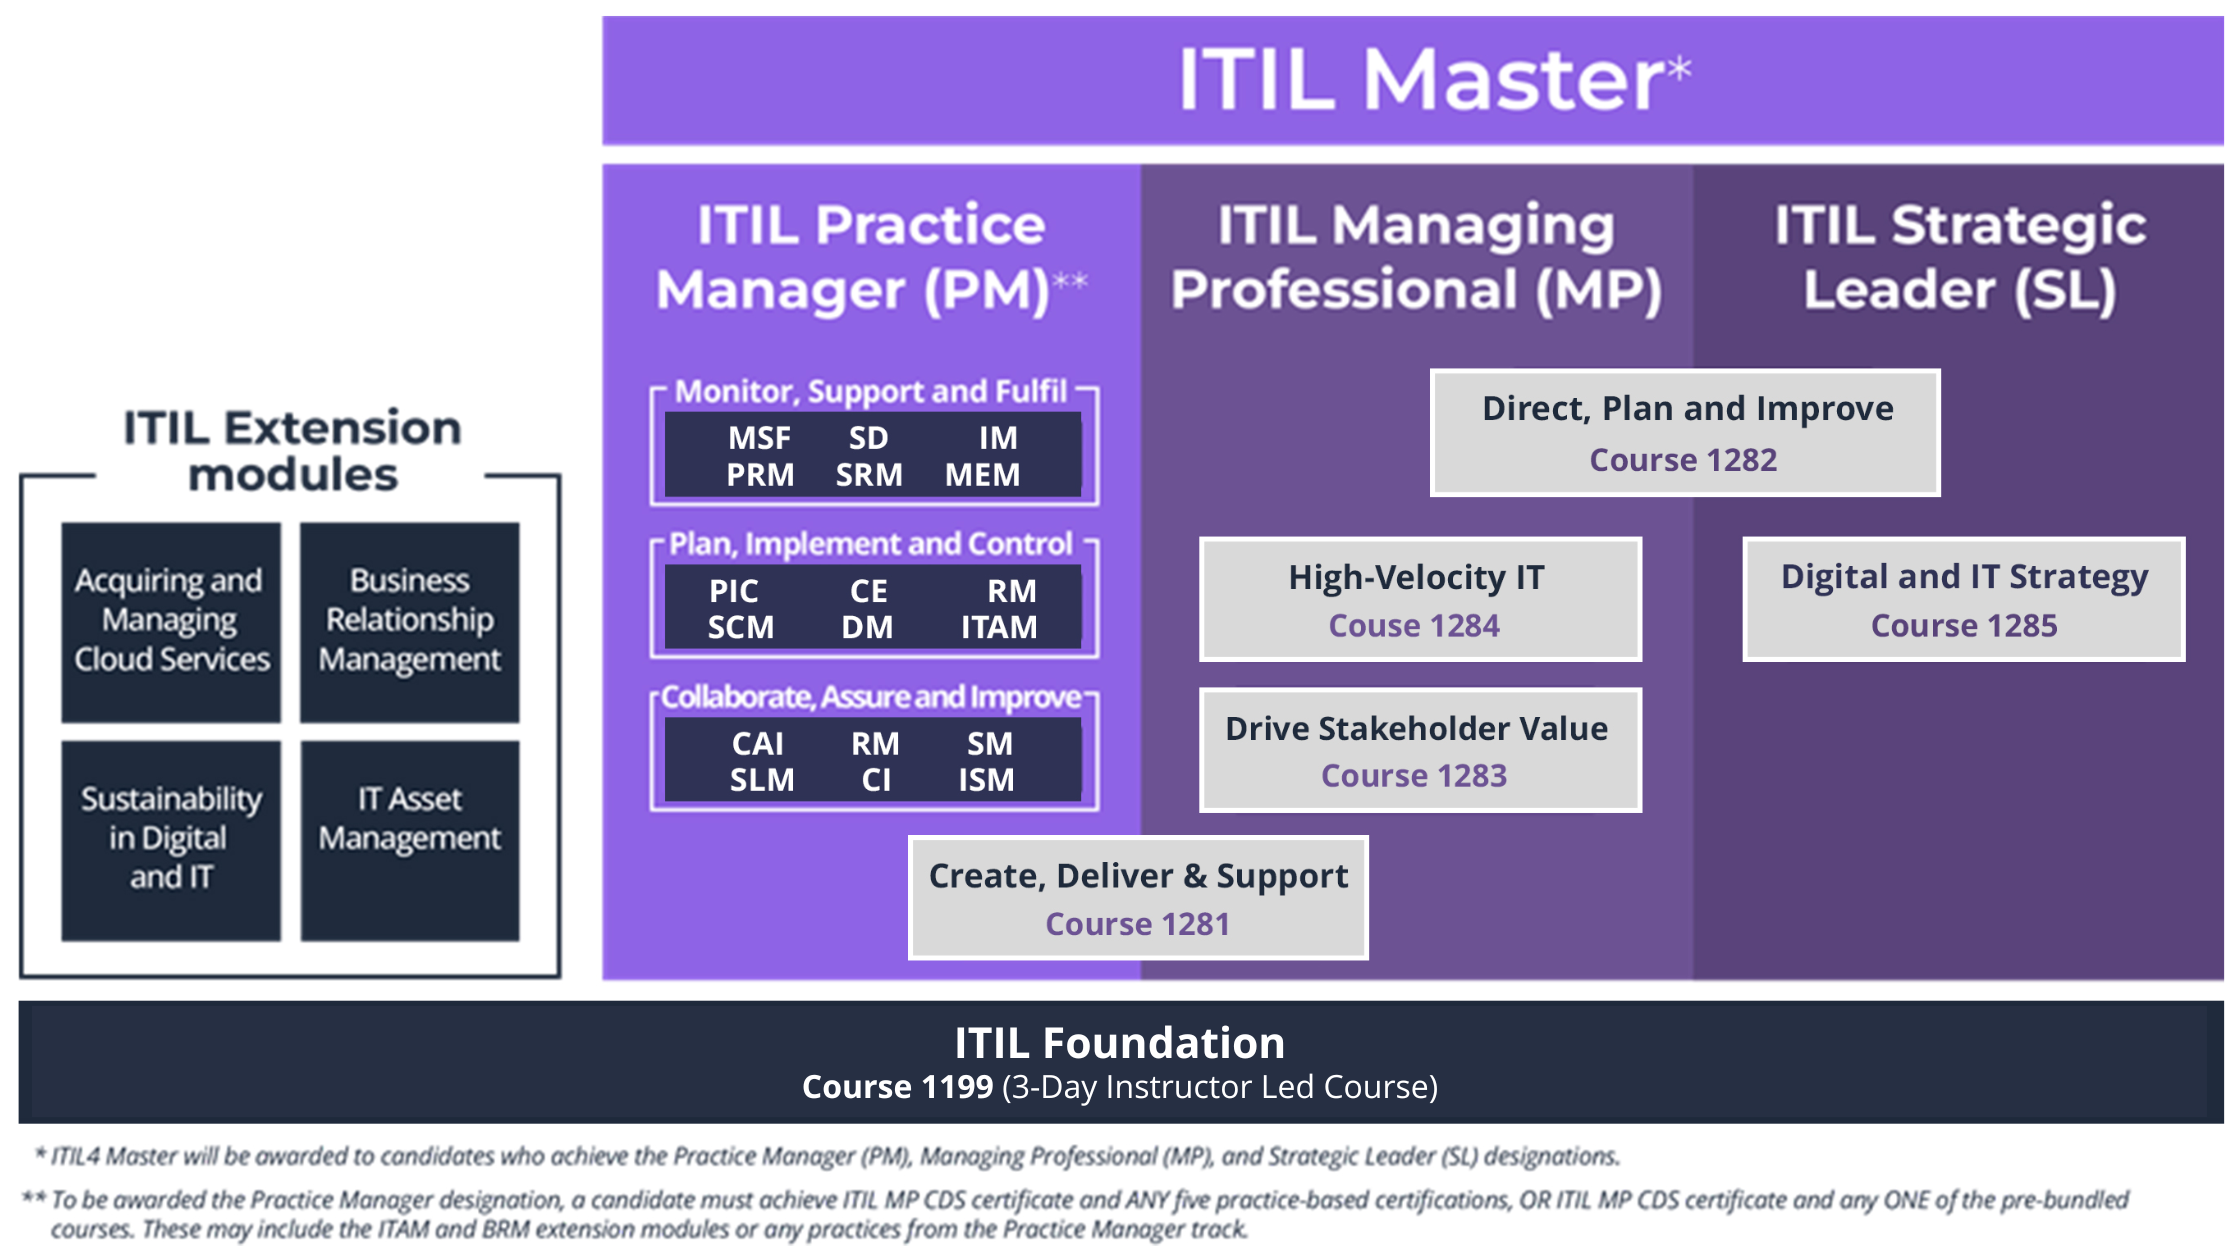
Infographic
ITIL 4 Master and ITIL 4 Foundation
-
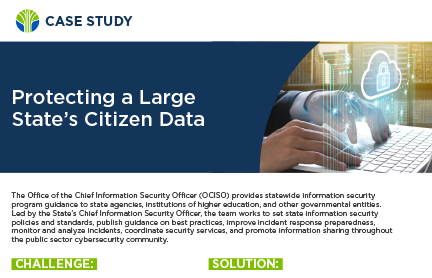
Case Study
Protecting a Large State's Citizen Data
-

Case Study
Business Case: System Integration
-
Case Study
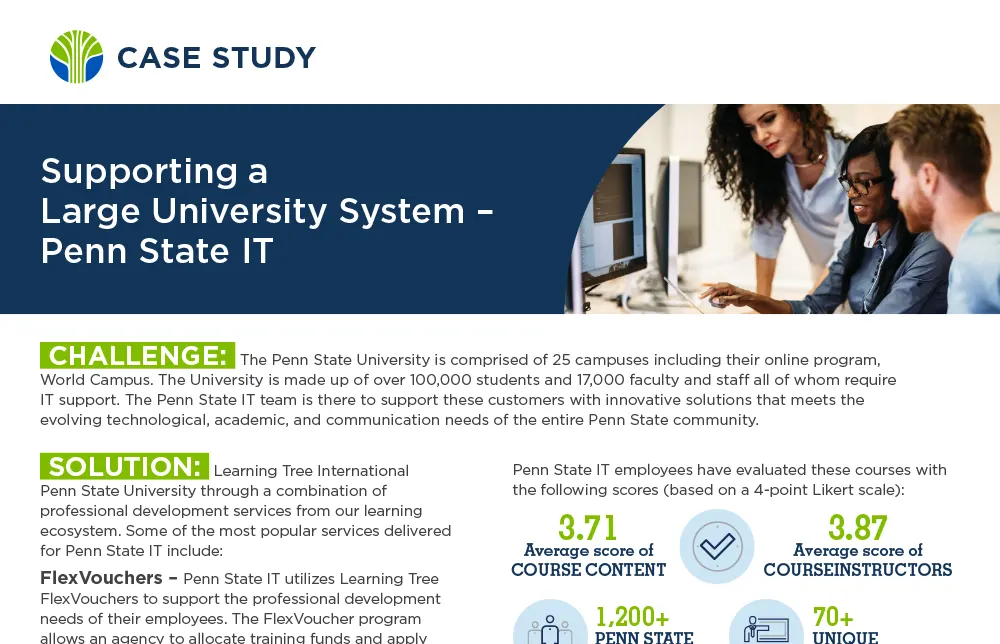
Case Study: Supporting a Large University System
-
Case Study
Case Study: Support City Agencies with Professional Development
-
Case Study
Case Study: Supporting an Evolving Customer Environment
-
Case Study
Business Case: Upskilling Staff with Customized On-Demand Training
-
Case Study
Case Study: From Waterfall to Agile
-
In the News
Learning Tree Launches Exclusive SecDevOps Certification with DevOps Institute
-

eBook/White Paper
Building Your Data Science Dream Team
-
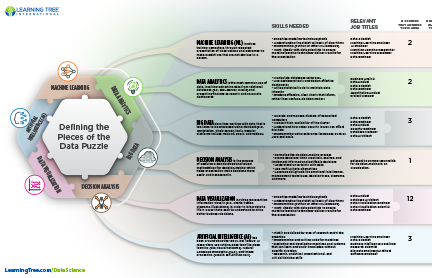
Infographic
Defining the Pieces of the Data Puzzle
-
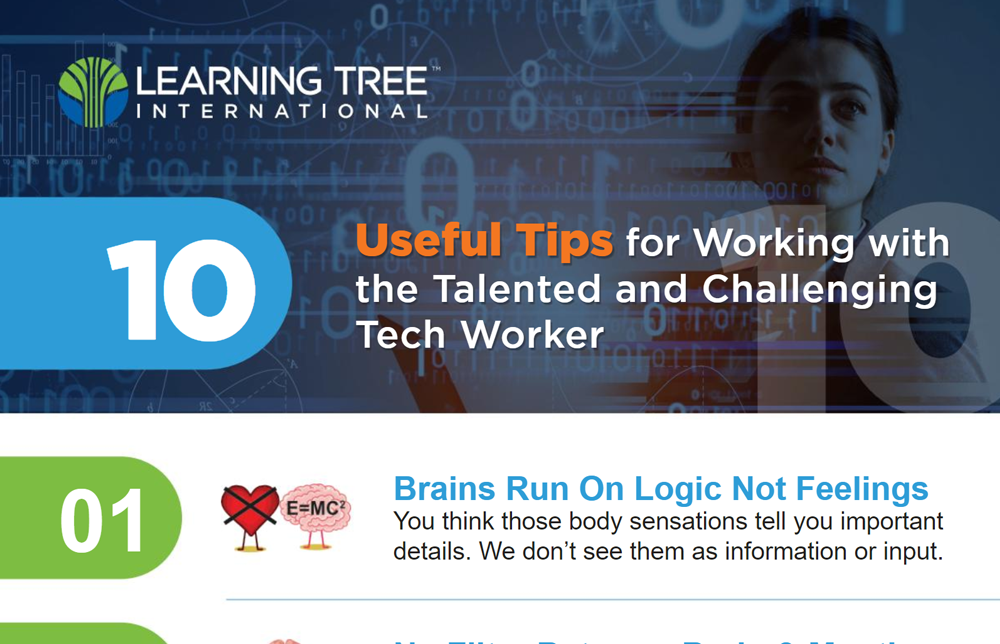
Infographic
10 Useful Tips for Working with the Talented and Challenging Tech Worker
-
Case Study
Case Study: Improving Forecasting & Predictive Capabilities
-

Catalogs
Learning Tree Training eCatalogue
-
In the News
Learning Tree Finishes 2020 with Trio of Industry Awards in Recognition of its Skill-Based IT & Cyber Security Training Curriculum
-
Solution Brief
Are Your Projects Really Failing?
-
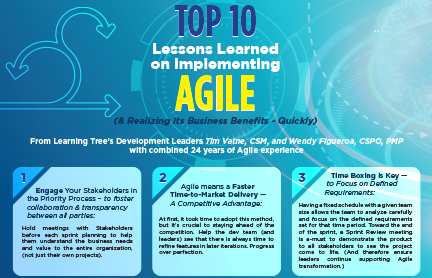
Infographic
Top 10 Lessons Learned on Implementing Agile
-

eBook/White Paper
How to Make Learning Stick
-
Case Study
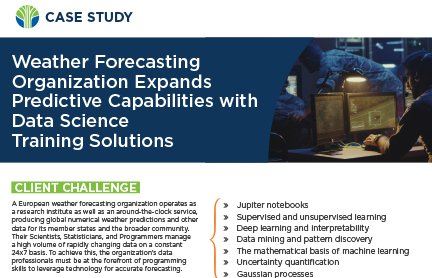
Weather Forecasting Organization Expands Predictive Capabilities with Data Science Training Solutions
-

Infographic
ISC2’s Certified Cloud Security Professional (CCSP)
-

Brochure/Learning Path
Microsoft Role-Based Certifications & Training
-
Brochure/Learning Path
Data Analytics, Big Data & Data Science
-
Case Study
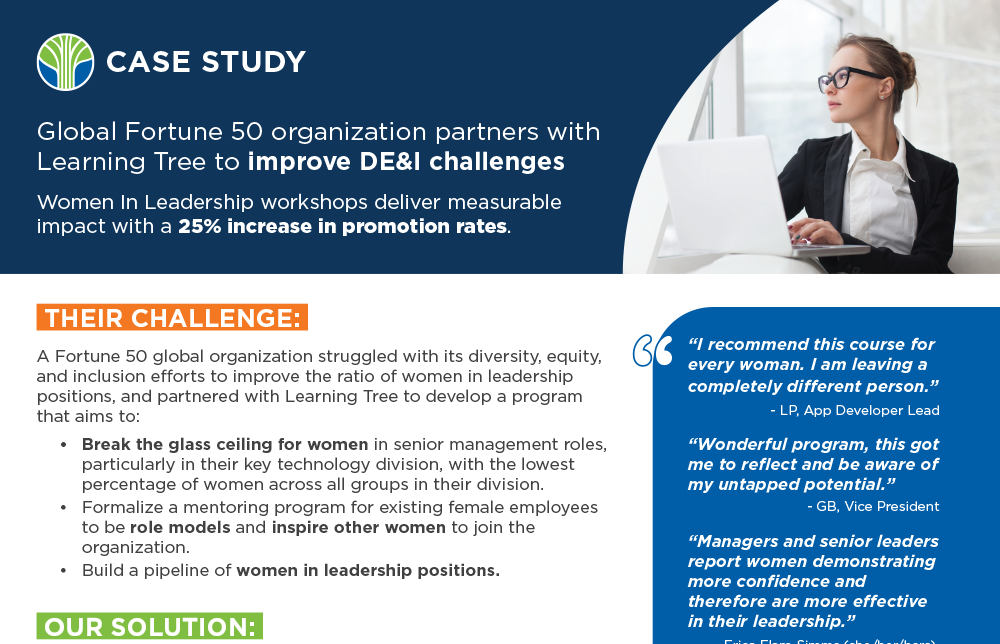
Financial Services Organization Investing in Developing Women Leaders: Greater than 25% Promotion Rate
-
Catalogs
On-Demand & Blended Learning Bundles eCatalog
-
In the News
Learning Tree Supports Business Continuity with All-Virtual Learning Options
-
eBook/White Paper
Adaptive Learning — A Personal Tutor for Each Employee
-
Case Study
Case Study: Global ITIL Implementation
-

Video
AnyWare®, The 100% Virtual Instructor-Led Training Platform
-
Video
Take an AnyWare® 3-Minute Tour
-
In the News
Virtual Learning Innovation with Adaptive and Collaboration Tools
-
Video
Supporting a Newly Remote Workforce with Microsoft Teams
-
In the News
Learning Tree Announces New Chief Executive Officer – David Brown
-
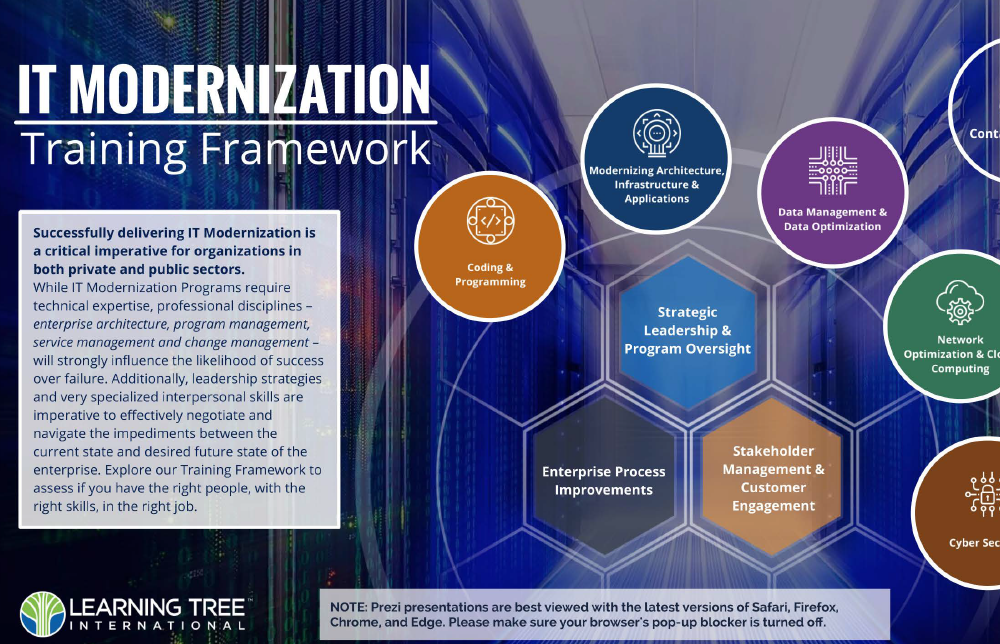
Brochure/Learning Path
IT Modernization Training Framework
-

Research and Reports
AXELOS ITSM Benchmarking Report 2019
-
Video
What is ITIL®?
-
Video
From AI to Adaptive, the Future of Learning is Here
-
In the News
Grasping Agile to Advance Outcomes Beyond IT
-
In the News
Learning Tree Partners with Area9 and Howspace for Learning Innovation
-
In the News
Learning Tree Recognized as Top 20 IT Training Company for Tenth Year
-
In the News
Learning Tree Expands Award-Winning Cyber Security Training Curriculum
-
In the News
Learning Tree Partners with CertNexus to Offer Cybersecurity and IoT Training
-
In the News
What skills will be needed to meet tomorrow's cyber security threats?
-
In the News
Learning Tree International and Howspace Announce a Partnership to Address Modern Learner Needs
-

Case Study
VA Acquisition Academy’s Project Acceleration Workshop Series for Activation Teams
-
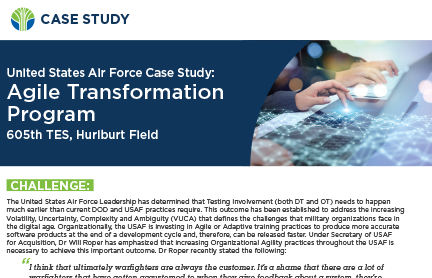
Case Study
United States Air Force Case Study: Agile Transformation Program
-
In the News
Learning Tree Celebrates 10 Years of AnyWare Virtual Training
-
In the News
Learning Tree & Columbus Technologies Announce Partnership Agreement
-
In the News
The Learning Evolution – where does innovation really matter?
-
In the News
Learning Tree International Partners with Suntiva for $100M FDA Integrated Services BPA
-
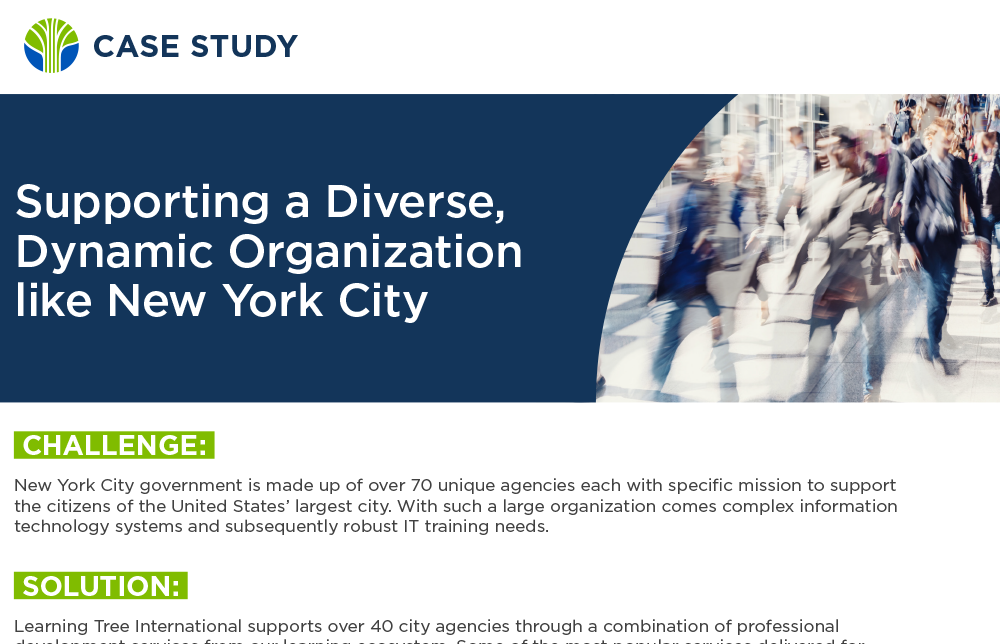
Case Study
Supporting a Diverse, Dynamic Organization like New York City
-
Video
Digital Transformation - The Importance of People and Culture
-
In the News
Learning Tree International Recognized by (ISC)² as 2018 Growth Partner of the Year
-

Case Study
Case Study: Improving IT Service Management with ITIL Implementation
-
In the News
Learning Tree International Donates Over 100 Trees for Local High School, Helps Plant Trees
-
In the News
Isn’t it time for the learning industry to align modern learner needs with sustainable results?
-
Video
ITIL 4 – A Conversation with the Experts
-
In the News
Learning Tree Recognized as Top 20 IT Training Company for Ninth Year
-
In the News
Expanded End-to-End Cybersecurity Certification Training from Learning Tree to Meet Mission-Critical Initiatives
-
Case Study
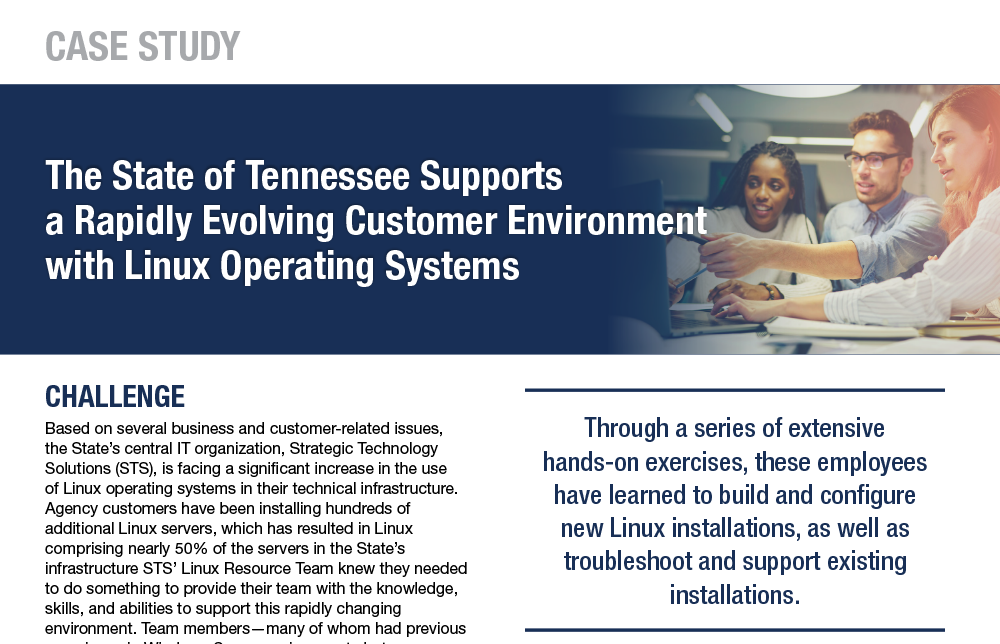
Case Study: Linux Operating Systems
-
In the News
Learning Tree’s Relocated Downtown Toronto Education Center Now Operational
-
In the News
Addressing IT Training Challenges: How Learning Tree Harnesses the Benefits of Blended Learning in the Workplace
-
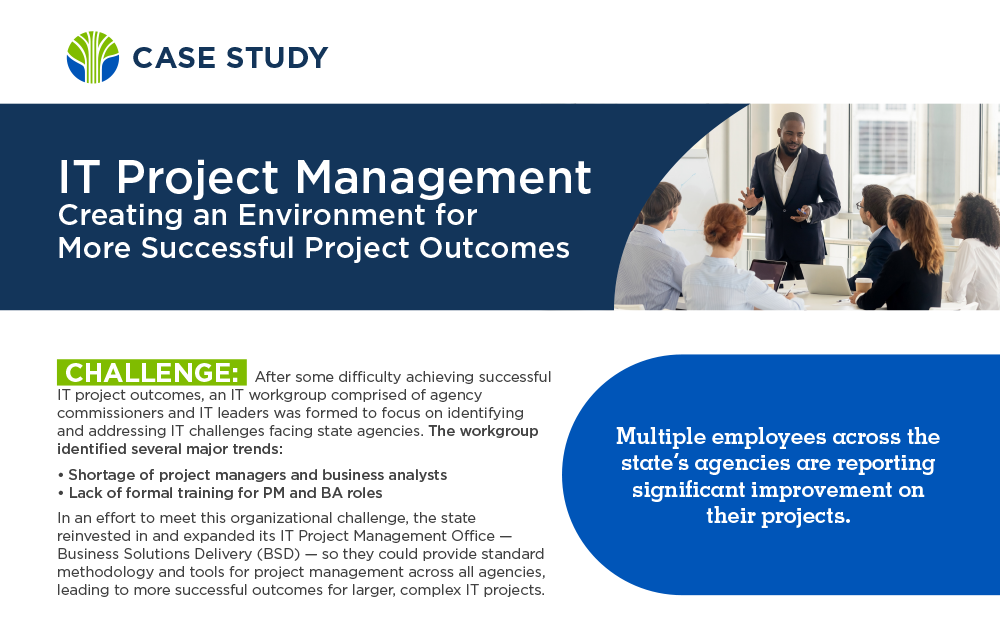
Case Study
Case Study: IT Project Management
-
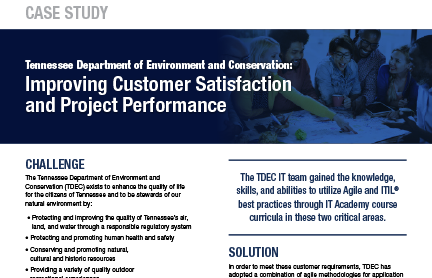
Case Study
Case Study: Improving Customer Satisfaction and Project Performance
-
In the News
Learning Tree Partners with (ISC)² to Deliver Health Care Security Practitioner Certification Training
-
In the News
Learning Tree Awarded the Texas Department of Information Resources InfoSec Academy Training & Education Services Contract
-
Video
3 Common Agile Project Management Myths Debunked
-
Research and Reports
Blended Learning Research Report
-

eBook/White Paper
Hands-On & Collaboration Workshops
-
eBook/White Paper
Do You Speak Agile?
-
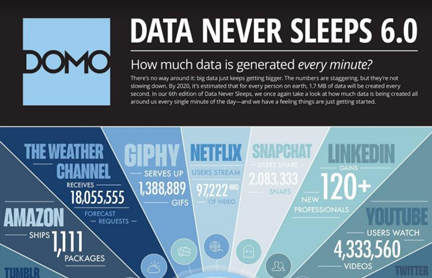
Brochure/Learning Path
Data Never Sleeps 6.0
-
In the News
Learning Tree Awarded Microsoft Gold Partner Status in Data Platform Training
-
In the News
Learning Tree Recognized as Top 20 IT Training Company for Eighth Year
-
eBook/White Paper
Agile Through & Through: Learning Tree Experts Talk Requirements | Design | Transformation
-
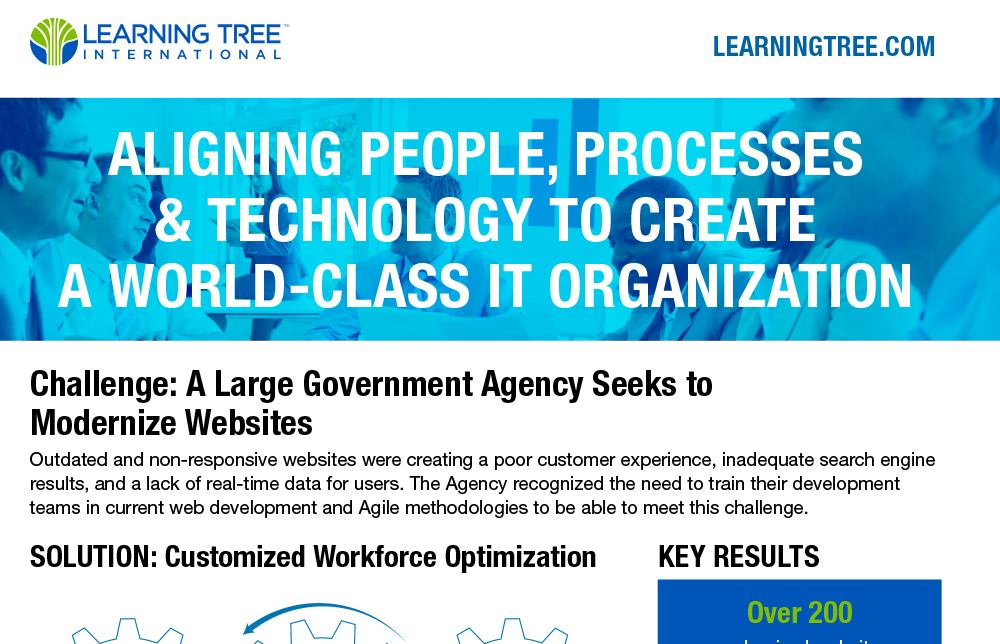
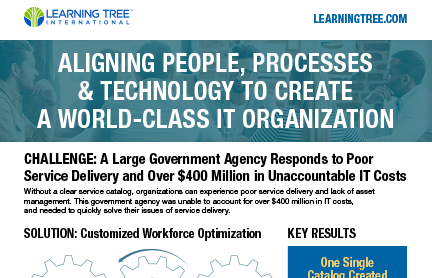
Case Study
Aligning People, Processes & Technology to Create a World-Class IT Organization
-
Solution Brief
Prioritizing Daily Tasks for Greater Productivity
-
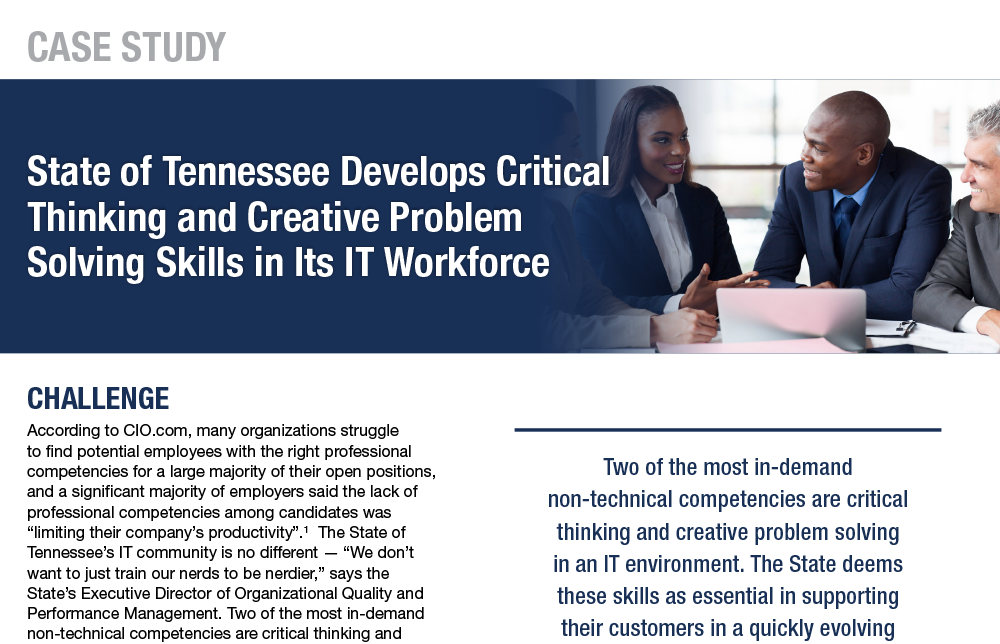
Case Study
Case Study: Critical Thinking & Creative Problem Solving Skills for IT Professionals
-
Infographic
On the Road to SharePoint Success
-
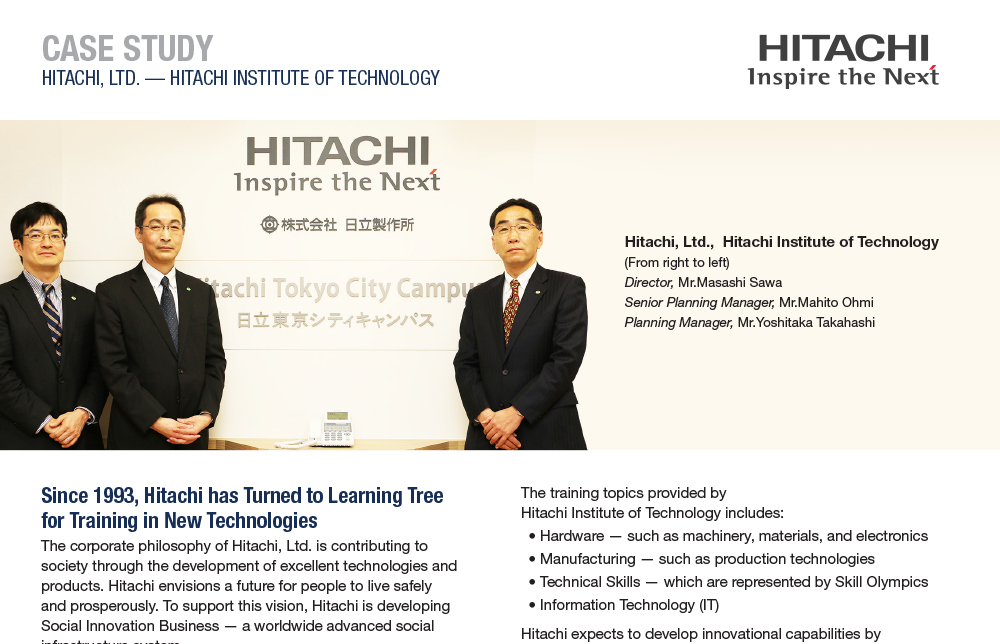
Case Study
Case Study: Hitachi, Ltd. — Hitachi Institute of Technology
-
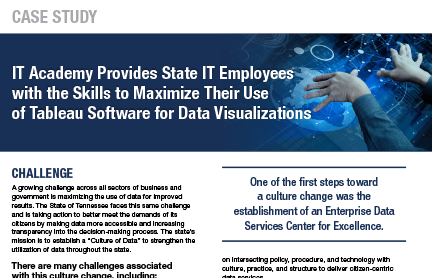
Case Study
Case Study: Tableau Adoption Success
-
In the News
Learning Tree CEO Elected as IAC Executive Vice Chair
-
Video
3 Agile Implementation Pitfalls & How to Avoid Them
-
Case Study
Business Case: Agile & Web Development Solutions
-
Case Study
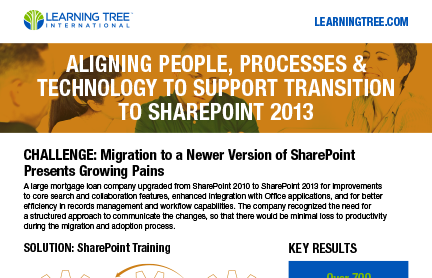
Business Case: SharePoint Migration Success
-
Case Study
Business Case: Improving IT Service Delivery
-
Case Study
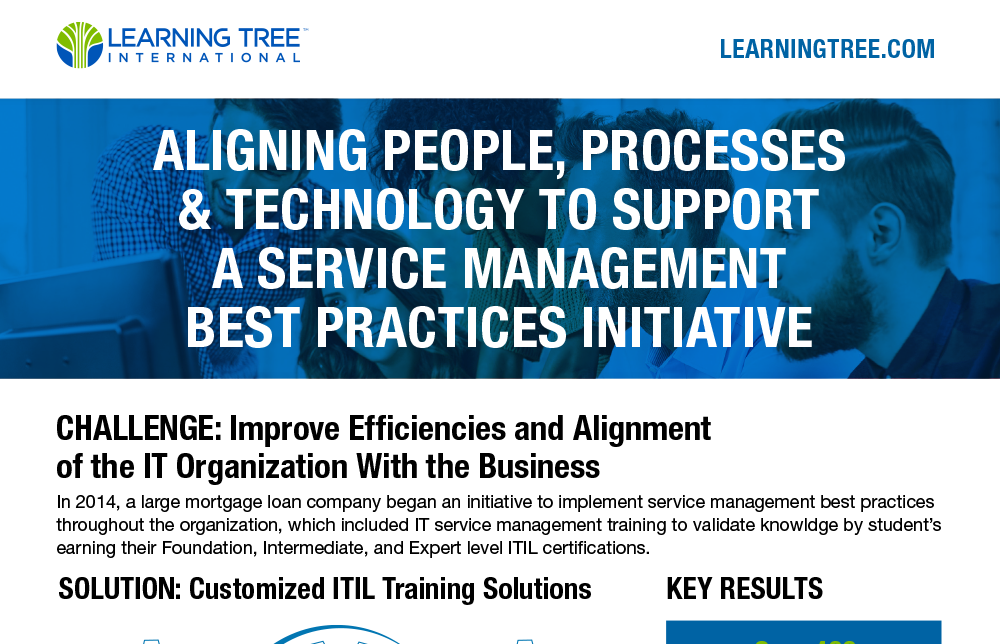
Business Case: Improving Efficiencies with ITIL
-
Case Study
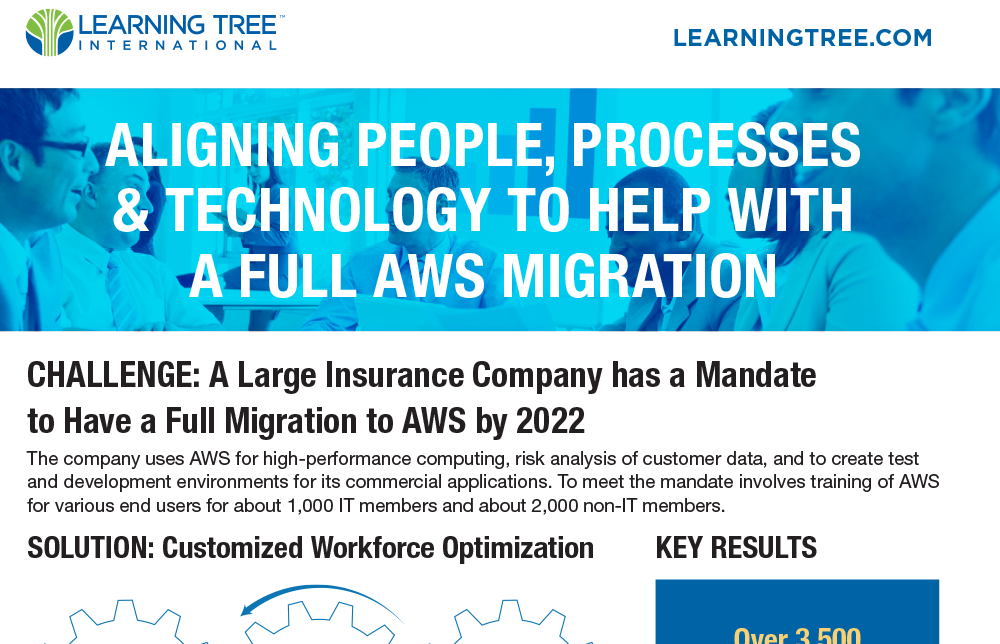
Business Case: AWS Migration Success
-
Solution Brief
Software as a Service (SaaS): Implications for the IT Security Workforce
-
Infographic
SMBs Face a New World of Work
-
Infographic
Agile vs Waterfall
-
Infographic
Azure Infographic
-
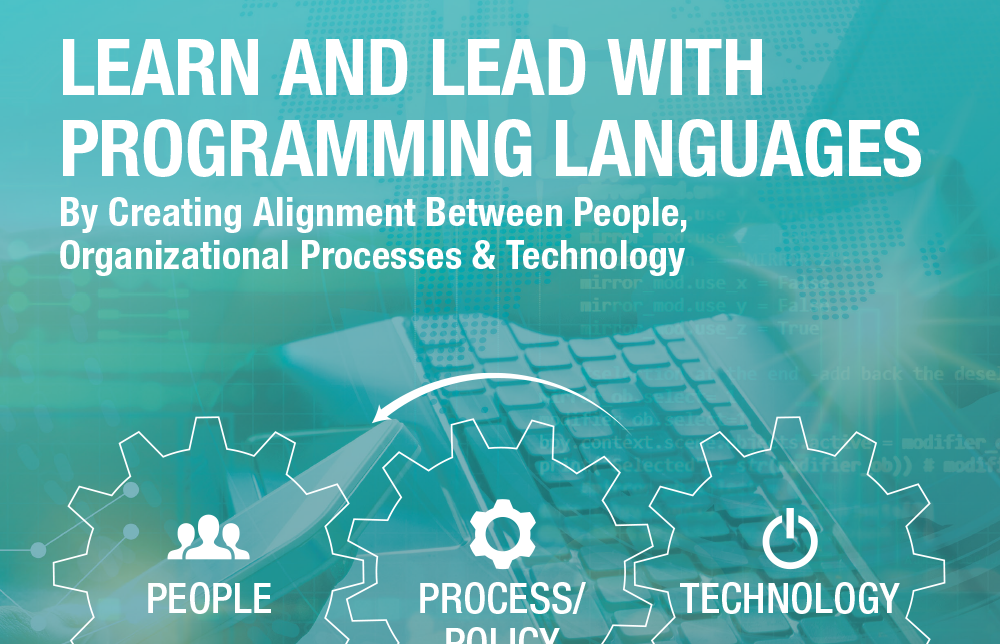
Brochure/Learning Path
Learn & Lead with Programming Languages
-
Brochure/Learning Path
Streamline & Optimize Product Delivery With Agile Development
-
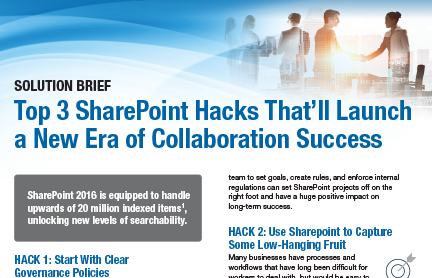
Solution Brief
Top 3 SharePoint Hacks That’ll Launch a New Era of Collaboration Success
-
Case Study
Business Case: Advancing Skills Beyond Asynchronous Training
-
Solution Brief
Managing the Threat of Security Breaches
-
eBook/White Paper
Optimize Workforce Performance With Blended Learning
-
Solution Brief
Business Case: ITIL Acceleration Workshops
-

Solution Brief
5 Ways to Unleash Excel's Potential & Avoid the Productivity Black Hole
-

Brochure/Learning Path
Make the Cloud Work Harder for Your Business
-
Brochure/Learning Path
Data Science & Analytics Learning Paths
-
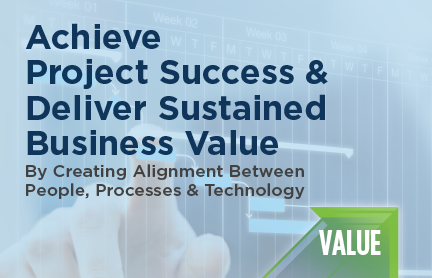
Brochure/Learning Path
Achieve Project Success & Deliver Sustained Business Value
-
eBook/White Paper
PRINCE2 Agile®: It’s All About Tailoring
-
Solution Brief
Three Business Analysis Nightmares
-
Brochure/Learning Path
Develop Your Leadership Voice & Professional Acumen
-
Infographic
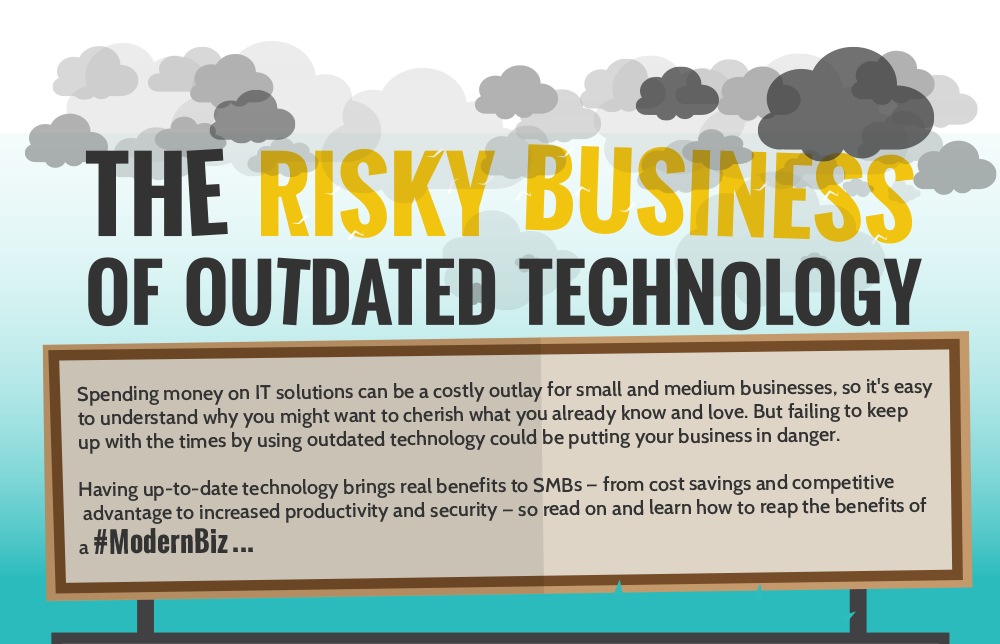
The Risky Business of Outdated Technology
-
Case Study
A Data Story: The Department of Children’s Services
-
Case Study
A Workforce Success Story: Tennessee IT Academy
-
Case Study
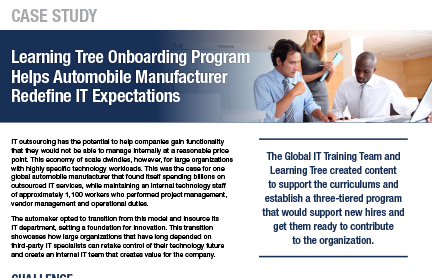
An Auto Manufacturer Redefines IT Expectations
-
Infographic
Training for the Modern Data Center
-
Solution Brief
Top 5 PMP Nightmares
-

Solution Brief
The Cloud: Tackling TCO
-
Solution Brief
Big Data Tsunami: 3 Investments to Ride the Wave
-
Solution Brief
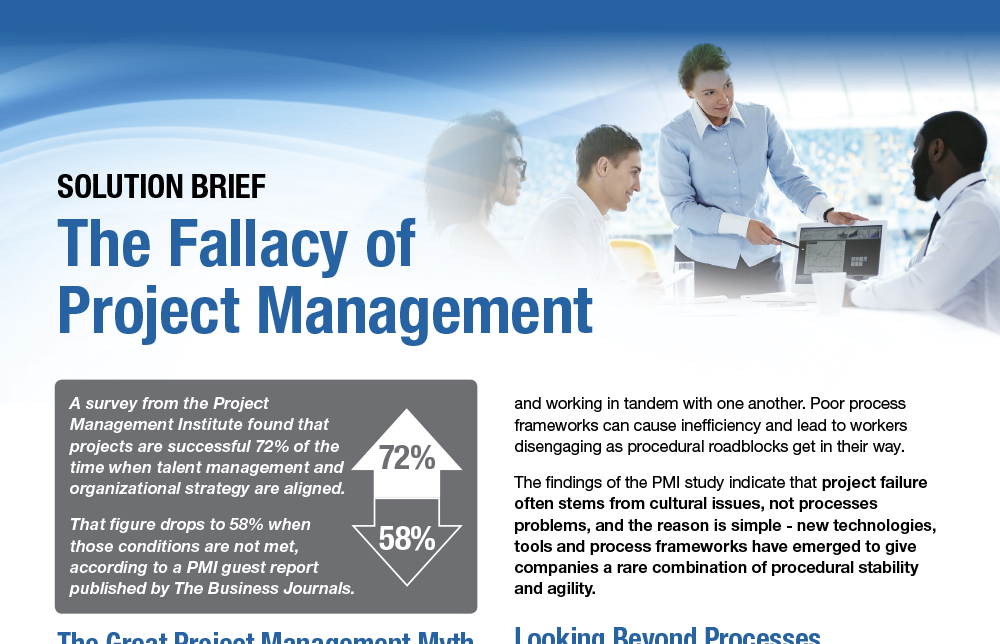
The Fallacy of Project Management
-
Brochure/Learning Path
Ensure a Successful ITIL Implementation
-
Brochure/Learning Path
The Future is Built on ITIL®
-
Solution Brief
Avoid Your LAST Data Disaster
-
In the News
Members of the Board and C-Suite Have New Tools to Help Reduce Cyber Security Risk
-

eBook/White Paper
3 Hurdles Every Project Manager Must Clear
-
Video
Beyond ITIL® Foundation Certification: What's Next?
-

Brochure/Learning Path
Top 10 Courses for Earning PMI PDUs
-
Case Study
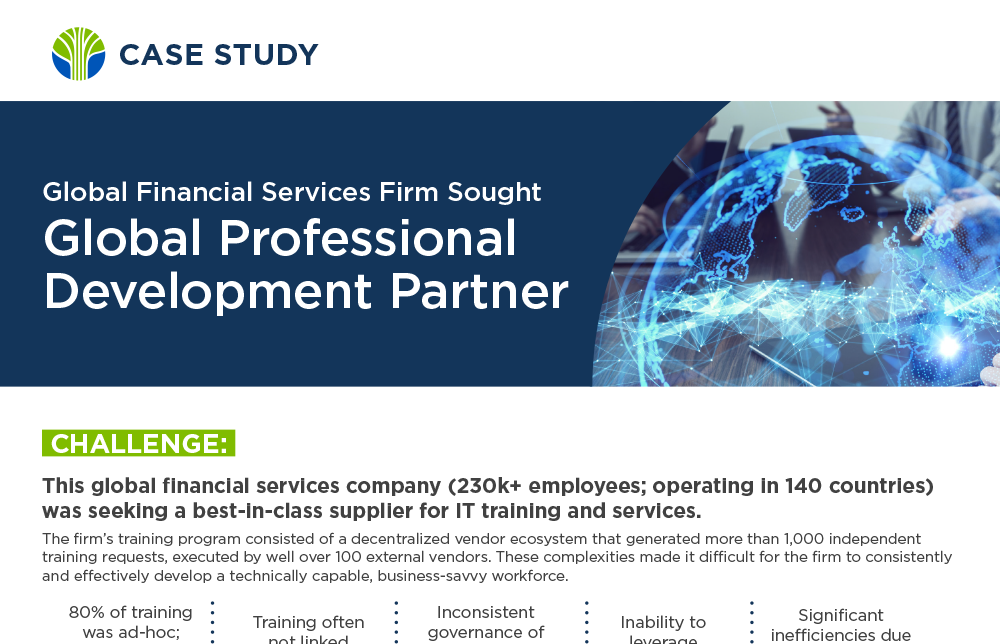
Global Financial Services Firm Sought Global Professional Development Partner
-

Brochure/Learning Path
PMI Resources: View Learning Tree PDU-Eligible Training
-
Brochure/Learning Path
DevOps Institute Continuing Education Credits (CEUs)
-

Brochure/Learning Path
Artificial Intelligence for Individuals
-
Brochure/Learning Path
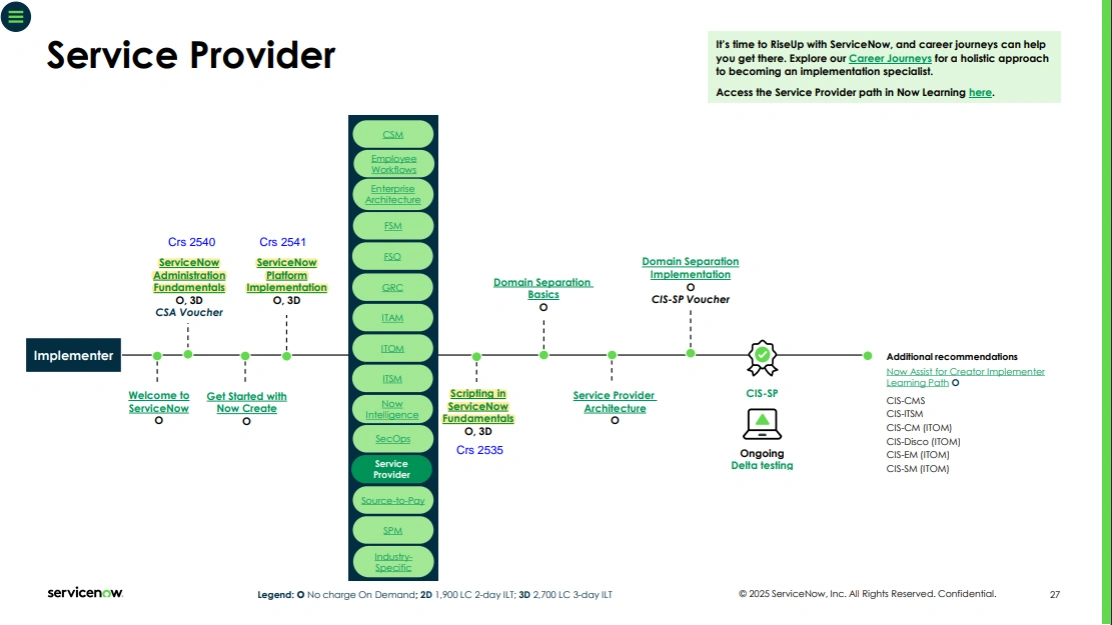
ServiceNow Learning Paths
Chat With Us
