My career would probably be going better if I were not so easily distracted.
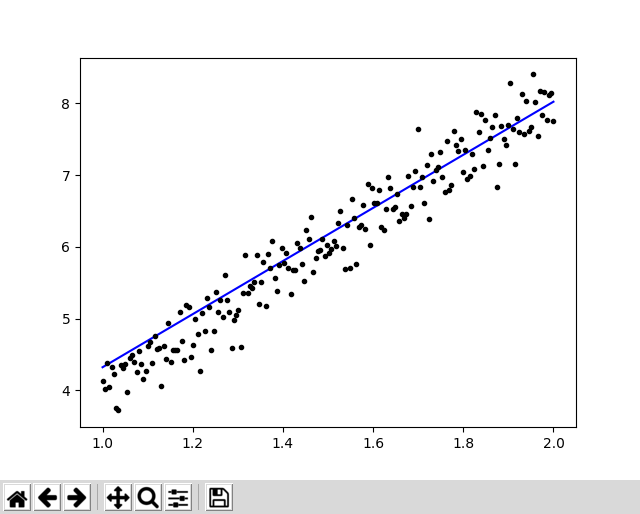
A recent distraction occurred when I was browsing for some simple Keras code to test an installation of Intel's PlaidML library. I came across a linear regression performed using Keras but the graph didn't look quite right. There were more points below the regression line than above it.
To be sure, there is not necessarily anything wrong with having an asymmetric distribution of points around a regression line. Usually, however, there are a few outliers "pulling" the regression line up or down. Didn't see anything that could explain the position of the line. Except that the line was just plain wrong.
It's pretty easy to create a set of points with any desired linear relationship. If we really want to test some methodology, however, we want to make sure that the random numbers we use to simulate deviations from the line are normally distributed rather than uniformly distributed.
This python code creates a set of points with errors normally distributed around a line with a slope of 4.
import numpy as np
x = np.linspace(1,2,200)
y = x*4 + np.random.randn(*x.shape) * 0.3
arrayTest = np.stack((x,y)) # note that x,y must be in parentheses
arrayTest =np.transpose (arrayTest)
After creating several sets of point, each set was analyzed by using Keras to create a Sequential model.
This is a "typical" miscalculations of a regression line for a set of random data:
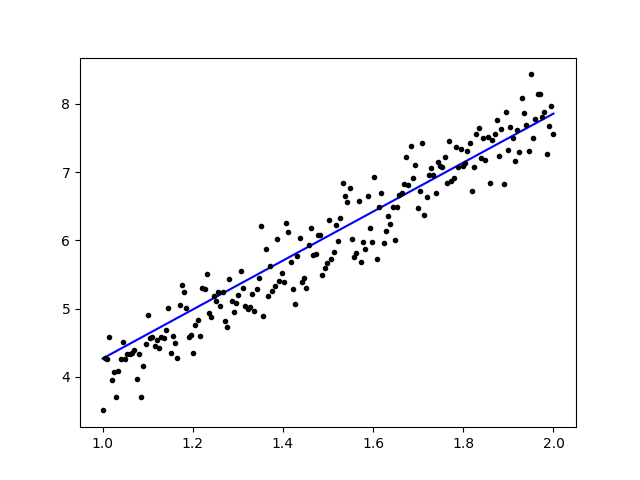
What about good old-fashioned OLS (Ordinary Least Squares)?
When apply a classic ordinary least squares algorithm to the data used in figure 1, the new regression line (shown in red) appears to fit the data well, but is it really better? We can get a definitive answer by comparing the squared errors. The mean least-squares error for the regression calculated using a machine-learning gradient-descent algorithm was 0.0953. The mean least-squares error for the classic OLS algorithm was 0.0773, a superior result.
It is worth noting that the newer algorithm took substantially longer to run, so our inferior result was obtained by spending far more CPU time!

Why does this happen?
Many machine learning algorithms improve the fit of a model by by randomly jiggling some parameters. If this achieves a reduction in loss, or cost, of whatever you choose to call it, the slightly better model can be the starting point for the next round of jiggling. The problem is that you can only jiggle your way into a better model that is nearby. If the best model is off in the distance, your algorithm will never find it.
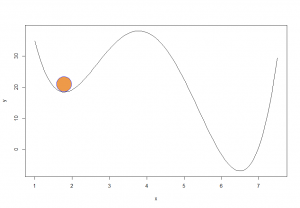
It's pretty hard to visualize this with lots of data points, and pretty much impossible with lots of dimensions. However, we can contrive an example drawing from your high-school calculus course.
Here we see a plot of a polynomial. The brown ball sits in a local minimum; any small jiggle can only push the ball up. If the language of physics, the ball has found an equilibrium point. In the language of ML algorithms, we have minimized the loss function. Neither the ball nor the algorithm know there is a smaller and better minimum sitting right nearby.
Conclusion
There are a couple of important take-home lessons here. First, if you plot a regression line, take a moment to look at it carefully. If you are not convinced your line is the best possible fit, take some time to investigate. Secondly, take care selecting an algorithm. The illustrations provided here should not be interpreted to mean there is anything wrong with Keras or the algorithms it enlists; it is simply a matter of choosing the right algorithmic tool for the right algorithmic job. Many of the newer machine-learning algorithms were designed for specific problems and will perform poorly if applied to problems outside that domain. Indeed, many were designed specifically for problems that are decidedly non-linear. Algorithms must be chosen wisely if you are to avoid inferior results.